
Your Amazon business doesn’t have a growth problem. It has a connective-tissue problem — and the dashboards you’re paying attention to were designed to hide it.
If you sell on Amazon, you already know the pressure of holding margin while the top line keeps climbing. Revenue is up. Ad-attributed sales look healthy. ROAS is acceptable.
And profitability still feels harder to defend every quarter.
That disconnect isn’t a feeling. It’s a signal. From the outside, the business looks like it is working. Underneath, margin is escaping through the seams between teams, tools, and decisions — and no single dashboard you own is built to see it.
It doesn’t break in one place. It leaks.
Revenue is easy to celebrate. Leakage is engineered to be invisible.
Most marketplace operators are drowning in performance metrics. Sales. TACoS. ROAS. Conversion rate. CPC. New-to-brand. Share of voice. Inventory weeks of cover. Category rank.
None of those metrics are useless. But every one of them measures movement, not money. They tell you the wheels are spinning. They don’t tell you where the fuel is going.
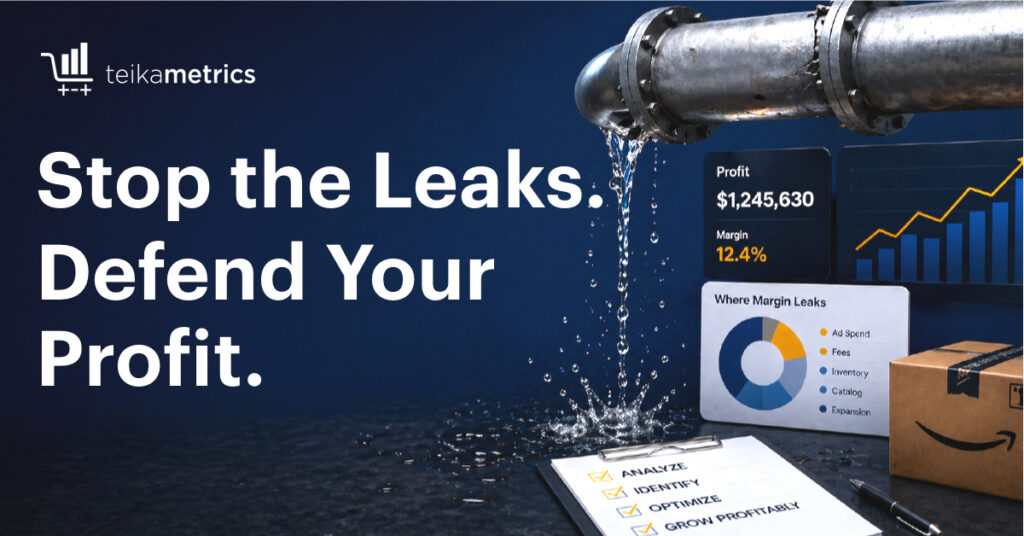
Profit is rarely lost in one line item. It disappears across the seams of the business — in ad spend rising to hold the same visibility, in fees that quietly increase per unit sold, in inventory decisions that build storage costs you didn’t price in, in catalog issues that force media to do work catalog should be doing for free, in channel expansion that adds complexity before the operating model is ready.
And the platform isn’t getting cheaper. Amazon’s own materials note 2026 U.S. FBA fee increases averaging $0.08 per unit sold, plus a 3.5% fuel and logistics surcharge applied to U.S. and Canada FBA fulfillment fees starting April 17, 2026. Sponsored Products keeps cost-per-click pressure on every visible placement. The cost of being seen and the cost of being shipped both go up.
That is why so many brands feel like they’re growing without getting healthier. The business isn’t unprofitable. It’s leaking — and the dashboards built to track growth are the wrong instruments to find the leaks.
See Where You’re Losing Profit
Most brands don’t need more effort. They need visibility.
An Opportunity Analysis gives you a clear view of where your business is leaking revenue — and what to do about it. We break down your performance across ads, catalog, and inventory to show:
- Where margin is being lost today
- Which products are actually worth scaling
- Where your current strategy is creating hidden inefficiencies
- How to grow without sacrificing profitability
→ Request your Opportunity Analysis
The five places margin escapes, and what a connected system catches
Leakage point #1: You are scaling spend faster than you are protecting margin.
A product starts converting. CPCs feel manageable. Revenue lifts. Budget follows. Soon, more spend gets concentrated behind the SKUs already showing traction.
That works. Until it doesn’t.
Ad efficiency in the console doesn’t tell you whether a SKU is worth scaling. A product can look great in ROAS and still be structurally weak once referral fees, fulfillment costs, promotions, returns, and contribution margin are counted. Amazon’s seller guidance is explicit: referral fees vary by category, and fulfillment fees keep shifting with annual changes and surcharges. Two SKUs at the same ROAS can have very different bottom-line outcomes.
This is where brands get tricked by revenue. They think they’re scaling what works. In reality, they’re scaling what converts, not what compounds.
The question to ask Monday morning: Which of my top 10 ad-spend SKUs are still profitable after all-in costs — and which ones am I subsidizing with ad budget?
ARI is built to answer that. It ties media performance back to true unit economics, so the SKUs you scale are the ones that actually compound margin — not the ones that are pretty in the ad console.
Leakage point #2: Your catalog is making your ad dollars work harder than they should.
Marketplace teams talk about media inefficiency as if it begins and ends in the ad account. It rarely does.
When listings are weak, content is incomplete, pricing is uncompetitive, or product pages convert below their potential, ads quietly start carrying the load. You can still buy traffic. You can still generate sales. But the cost of holding that performance climbs — because media is doing work catalog quality should have been doing for free.
That cost doesn’t show up as a line item called “weak catalog.” It shows up as creeping CPC, declining organic share, and a TACoS that won’t sit still.
The question to ask Monday morning: Where am I paying media tax to compensate for a catalog problem I haven’t fixed?
ARI flags it. Instead of optimizing ads in isolation, it identifies where media is compensating for listing, content, or pricing weakness — so the fix happens where the leak actually lives.
Leakage point #3: Inventory costs keep building while everyone is watching revenue.
Inventory is one of the easiest places for margin to vanish without earning executive attention. It doesn’t show up in the weekly performance review. It shows up two months later, in a P&L line everyone is surprised by.
Amazon charges monthly inventory storage fees and applies an aged inventory surcharge to units stored 181 days or longer. Sellers using FBA inbound placement options can incur additional placement fees depending on how shipments distribute across the network. Each one of those is a margin event that started weeks earlier in a forecast.
Inventory mistakes aren’t operational problems. They’re profit problems wearing operational disguises. Overcommit to the wrong SKUs and margin erodes in storage and aging fees. Under-support the right ones and you miss demand and force inefficient budget shifts to recover. Disconnect ad strategy from inventory planning and the business creates its own volatility.
The question to ask Monday morning: Which SKUs am I scaling demand for that my supply chain can’t profitably fulfill?
ARI connects the two sides. Demand signals from media and search inform inventory decisions; inventory reality informs which products you scale. The result is fewer surprise storage bills and fewer budget reallocations driven by stock pressure you should have seen coming.
Leakage point #4: You are treating each metric like a win, instead of asking whether the system is working.
This is where sophisticated teams still get stuck.
Paid media says demand is rising. Retail says conversion is soft. Ops says inventory is uneven. Finance says margin is under pressure. Leadership wants growth, but only efficient growth.
No one is technically wrong. Every team is hitting their number. And nobody is looking at the whole machine.
This is the leak that no individual dashboard will ever catch, because each dashboard is doing what it was designed to do. Vanity at the function level. Loss at the system level.
The question to ask Monday morning: Which of my team’s “wins” this quarter actually moved profitability — and which were optimized at the expense of it?
This is the gap ARI is built for. Not another tool to manage another lever — a layer that connects the levers, so a win in one place isn’t quietly creating a loss in another.
Leakage point #5: Expansion creates new revenue and new places to lose margin.
Most brands today are still Amazon-first, but not Amazon-only. They’re evaluating Walmart. They’re watching TikTok. They know multichannel is part of the growth conversation.
But expansion doesn’t solve a profitability problem. It can intensify one.
Walmart Marketplace pitches zero setup, monthly, or hidden fees — but still charges referral fees that vary by category and product type. TikTok Shop has its own seller fee structure and transaction economics for qualified orders. Each channel introduces a different margin model, not just a different source of demand.
If a brand is already leaking on Amazon, lifting that operating model into Walmart or TikTok doesn’t fix the leak. It widens the surface area.
The strategy isn’t “go everywhere.” It’s “make multi-marketplace growth predictable before it’s distributed.”
The question to ask Monday morning: Have we proven we can hold margin on Amazon before we ask the same operating model to hold it across three more channels?
ARI maps the leak before it scales. It tells you whether the current model can profitably hold weight on Walmart or TikTok, channel by channel, before you commit the budget to find out the hard way.
The real question brands should be asking
Most teams ask: How do we grow faster?
A better question — and the one we’d argue is the only question worth running your quarter on: Where are we leaking margin today, and which decisions across teams are creating it?
That reframe changes the conversation from performance reporting to profit diagnosis.
From “Which campaigns are winning?” to “Which decisions are actually creating durable growth?”
From “How do we increase spend?” to “Which products, channels, and operational moves deserve more investment?”
It moves the unit of analysis from the metric to the system that produces it.
What changes when the system can see itself
At this point, most brands don’t need more data. They have dashboards. Reports. Channel-level insights. What they don’t have is a clear view of how those pieces interact — and where money is actually being lost between them.
That’s the gap. Leakage doesn’t happen in one place. It happens across the interactions:
- between ads and margin
- between catalog quality and conversion
- between inventory decisions and demand
- between channel expansion and operational control
Look at those pieces separately and you’ll keep missing what’s really happening.
That’s where ARI comes in — not as another tool to manage one more lever, but as the layer that ties the levers together.
Instead of optimizing ads in isolation, ARI ties performance back to the underlying drivers of profitability. It helps you:
Align spend to true profitability. Not just which products are converting — which ones actually drive margin after fees, fulfillment, and costs.
Identify where ads are compensating for deeper issues. Highlight where media is propping up weak listings, soft pricing, or underperforming catalog decisions — so the fix happens where the leak lives.
Connect demand to inventory reality. Stop scaling SKUs that create stock pressure. Stop underinvesting in the SKUs that can absorb efficient growth.
Surface inefficiencies across the system. Not just what is happening, but where decisions across teams are creating unnecessary cost or missed opportunity.
Create a clear path for expansion. Know whether your current model can scale profitably into Walmart, TikTok, or beyond — before the budget commits.
Instead of asking “Which campaigns are working?” or “Which SKUs are converting?” or “Where should we spend more?” — you start answering the questions that actually drive profitability.
Which products should we be scaling, and which should we stop pushing? Where is ad spend compensating for deeper issues? Where are we creating demand we can’t fulfill efficiently? Which channels are truly incremental, and which are just adding cost?
Once you can see how those decisions interact, the leaks become obvious. And — more importantly — they become fixable.
The bottom line
If your marketplace business feels less profitable than it should, it probably isn’t because growth has stopped working. It’s because too much of that growth isn’t translating into profit.
A little more spend here. A little more fee pressure there. A few inefficient products scaled too far. A few operational decisions that never got corrected.
Individually, none of them break the business. Together, they quietly drain it.
That’s what leakage looks like. And the hardest part is that you usually can’t see it clearly when you’re inside it. Every team is optimizing something. Every metric is moving in the right direction. And the outcome still doesn’t add up.
That’s the case for connecting the system. That’s the case for ARI.
See Where You’re Losing Profit
Most brands don’t need more effort.
They need visibility.
An Opportunity Analysis gives you a clear view of where your business is leaking revenue—and what to do about it.
We break down your performance across ads, catalog, and inventory to show:
- Where margin is being lost today
- Which products are actually worth scaling
- Where your current strategy is creating hidden inefficiencies
- How to grow without sacrificing profitability