
Part 2 of a three-part Cyber Week Teika AI series. Read Part 1, focusing on Cyber Week CPC and Conversion Rate trends by category here.
Cyber Week may feel like a ‘make or break’ period for the holiday season. However, the data shows that, for many categories, the weeks following the sale period can actually be the most lucrative.
In the past, Cyber Week was primarily focused on electronics and other ‘big ticket’ type items. Shoppers may have bought gifts for themselves, or bought typically higher-priced items for the family that aren’t usually on sale. After Cyber Week, buying behavior would then shift to a wider variety of categories, towards things like jewelry, toys, tools, and other gift-related items.
Today, the data shows us that consumers are now increasingly using Cyber Week for Christmas and other holiday shopping across categories, knowing that deals are baked in. Additionally, ‘last minute shopping’ has become easier to manage thanks to widespread two-day shipping, making the post-Cyber Week period more active in aggregate than Cyber Week itself.
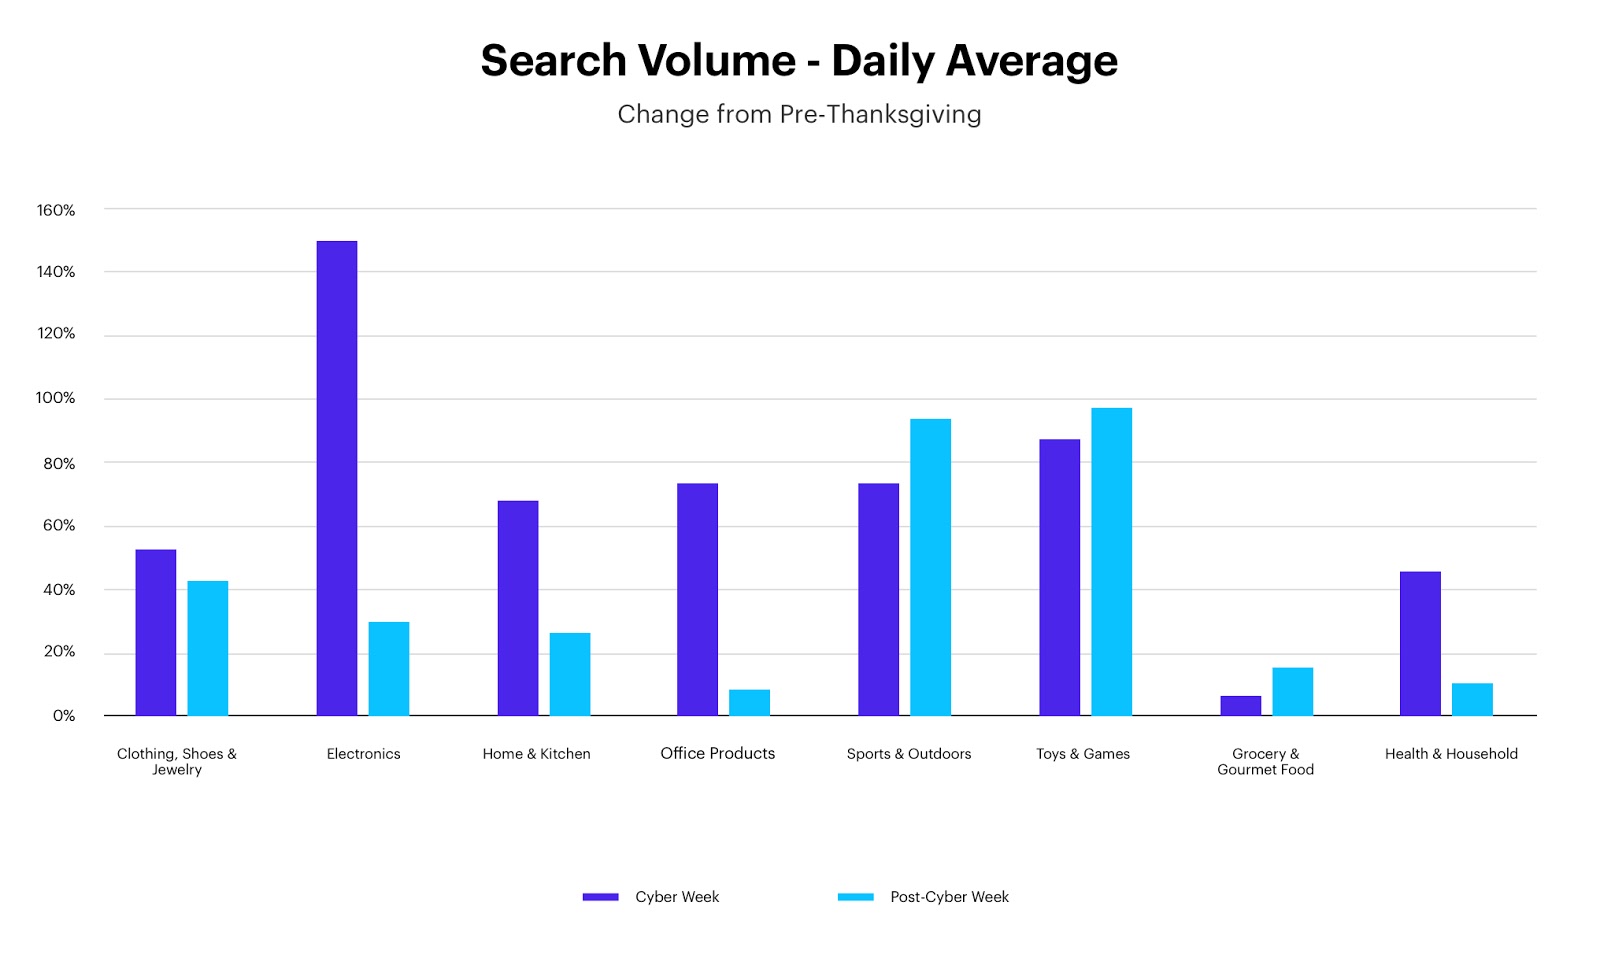
You can see volume increases across the board during Cyber Week, demonstrating how this has become a de facto shopping holiday, nearly regardless of category. Grocery & Gourmet Food, a category more populated with commoditized products, provides contrast with its more modest increase. It’s worth noting that compared to pre-Thanksgiving daily averages, Sports & Outdoors and Toys & Games actually see larger increases after Cyber Week, compared to the event itself. This supports the hypothesis that “last minute” shopping is a major driver across select categories.
Cyber Week Data Change from Pre-Thanksgiving
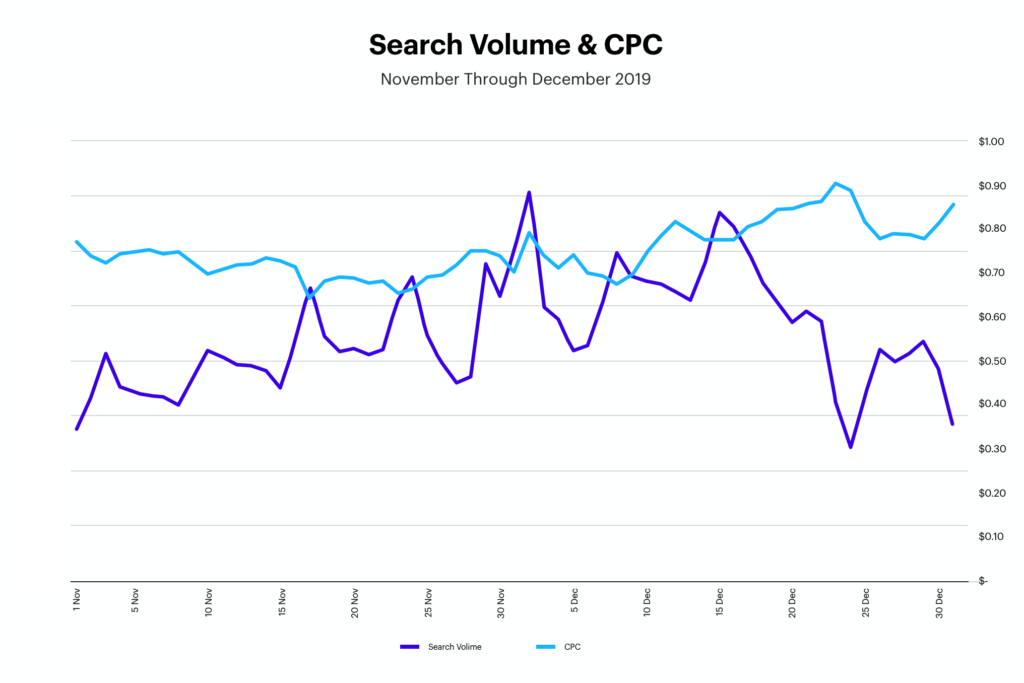
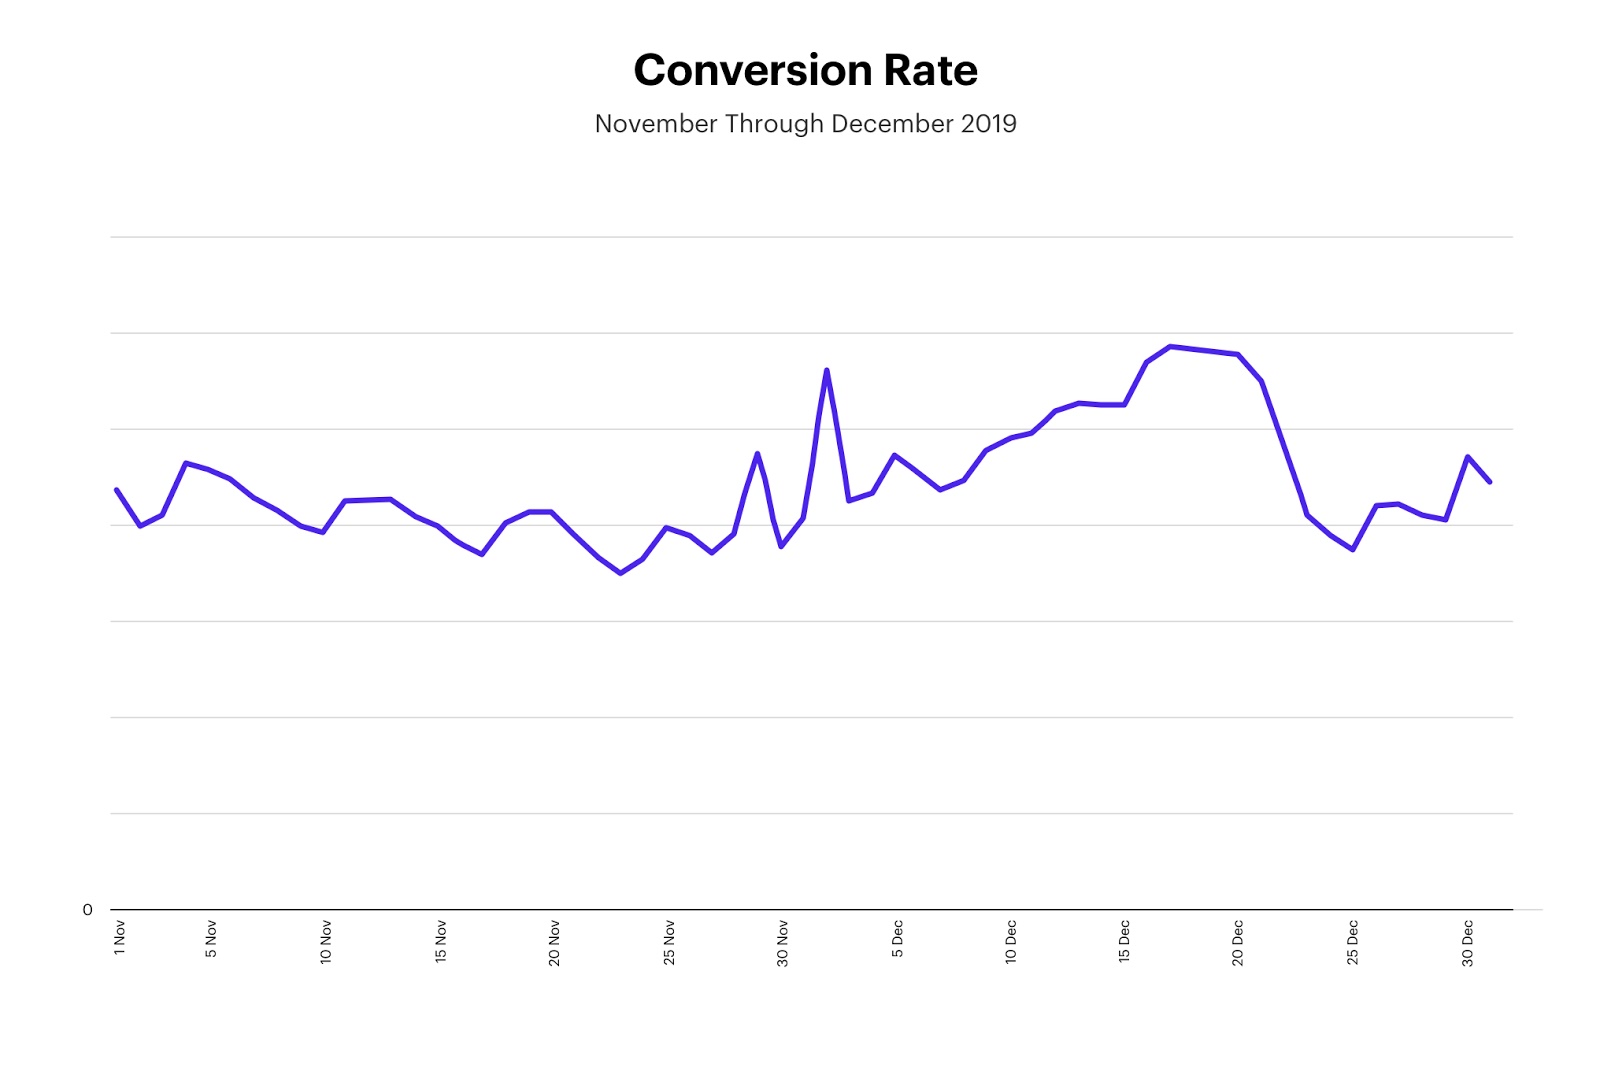
The charts below break down change in search volume, conversion rate, and CPC by category during Cyber Week and in the weeks following, compared to the days prior to Thanksgiving.
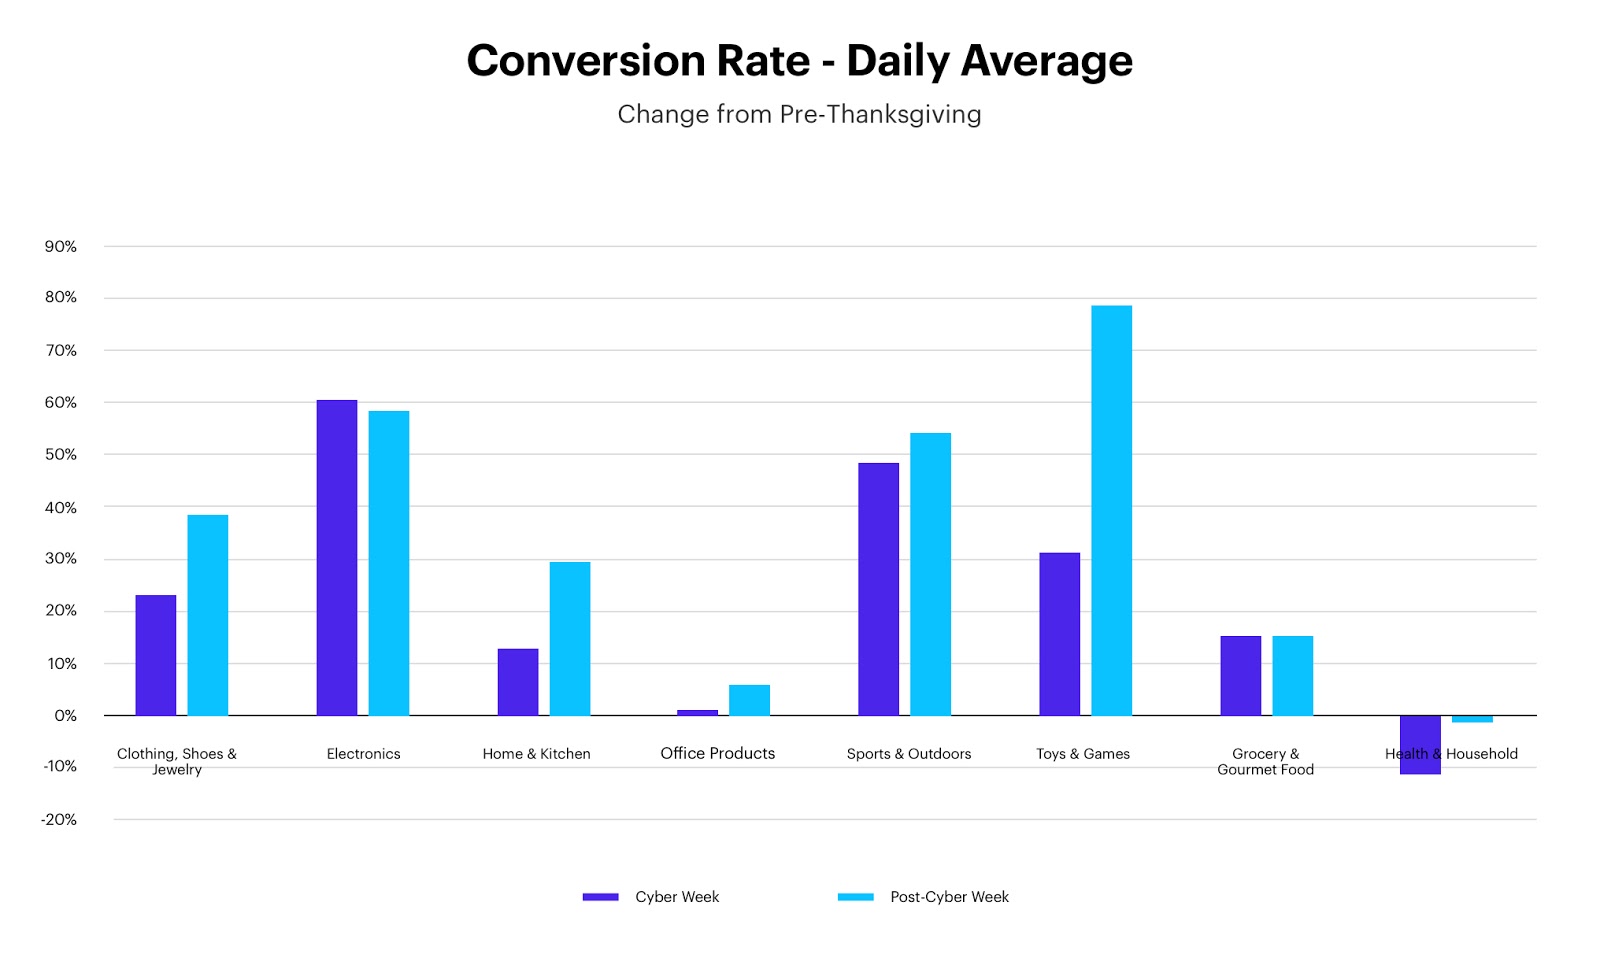
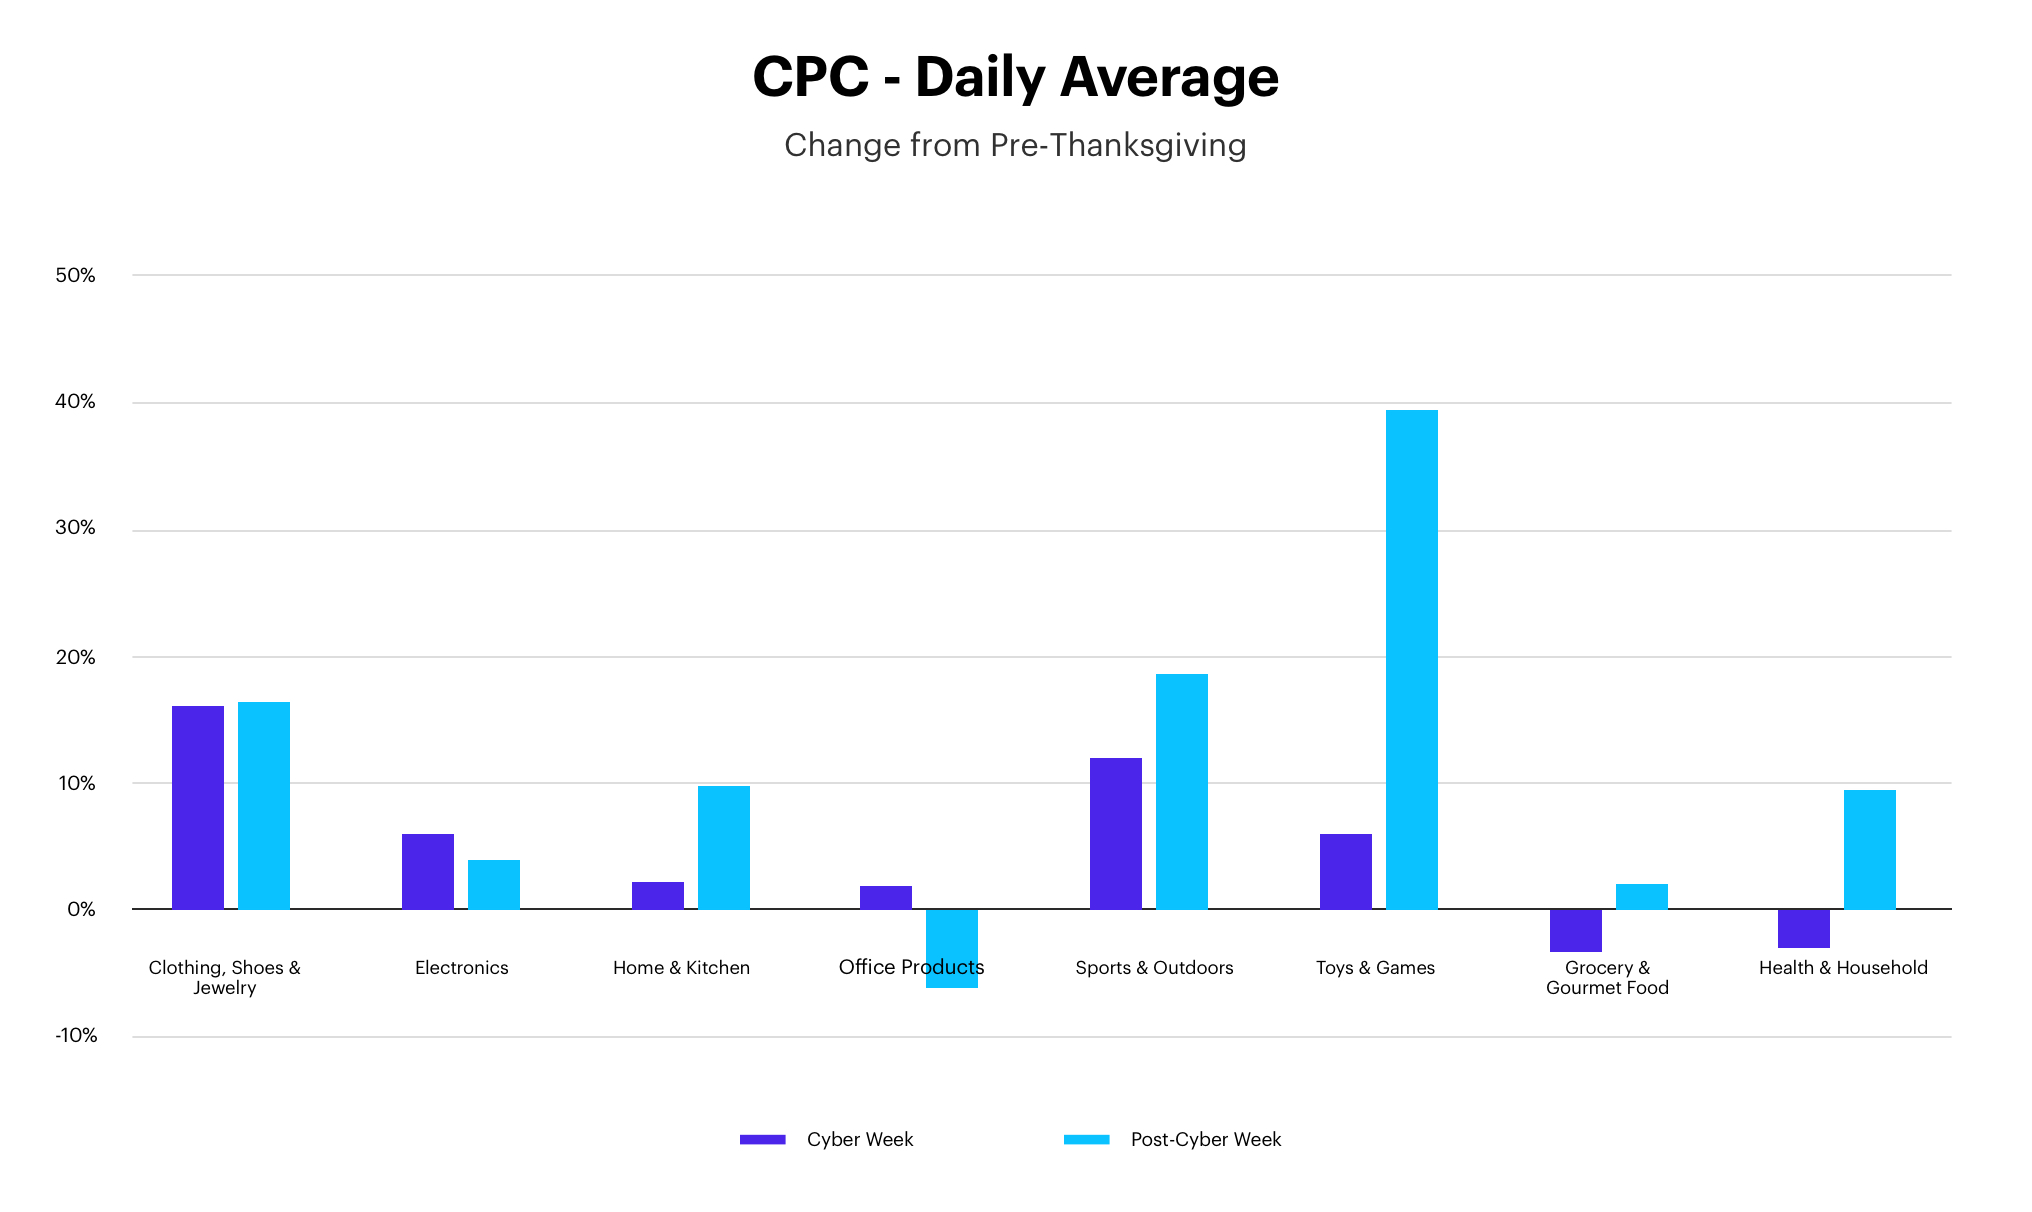
Conversion rate increases across just about every category, on top of those volume increases, underscore the immense opportunity of the holiday season for sellers. CPCs generally rise modestly (with some exceptions) suggesting that while holiday season traffic may be more expensive to capture, the commensurate value of that traffic justifies the price.
Takeaways For Cyber Week And Beyond
This is why our bidder determines bid aggressiveness based on conversion rate trends, rather than ACOS or other efficiency minded metrics, as long as the bid fits with the seller’s profitability goal. Provided there’s enough volume, conversion rate is the quickest signal showing an ad is resonating with consumers and is likely to drive more, profitable sales.
These statistics also underscore how consumers remain incredibly active throughout the latter portion of the holiday shopping season. Outside of Sponsored Products and Sponsored Brands, sellers and brand owners should consider Amazon DSP during the post-Cyber Week period to get in front of more of these in-market shoppers both on and off of Amazon.
While Cyber Week deservedly gets a lot of attention from sellers and brand owners, search volume and conversion rates across many categories actually hold steady or increase from Cyber Monday all the way through the late-December shipping cutoff. Just keep in mind that the exact date of the shipping cutoff in 2020 could be earlier than the 23rd if there are COVID-related FBA challenges on Amazon’s side.
Speaking of Cyber Week 2020, stay tuned for a detailed wrap up of what happened this year from Teikametrics’ Data Science team once the sale event ends.
Happy holidays!
—-
Teikametrics’ Data Science Team Mission
The use of machine learning technology is largely restricted to companies with incredible resources at their disposal. Teikametrics’ Data Science team aims to democratize the power of AI-backed decision making for ecommerce businesses by providing brand owners and sellers around the globe with transparent and understandable data-driven insights, recommendations, or actions.
Methodology
Each ad group across the Teikametrics database from 2019 was identified with one or more product categories based on the ASINs of which they are composed. The average daily impression volume for each ad group, conversion rates, and CPCs within product categories were computed over the periods 11/1/2019-12/22/2019. The period defined as ‘pre-thanksgiving’ was 11/1 through 11/27, ‘Cyber Week’ was 11/29 through 12/2, and ‘Post Cyber Week through December 22’ as 12/3 through 12/22.