If you want to tackle the two e-commerce giants, Amazon and Walmart, you will need data. It can take a lot of work to keep up with their regular updates, changes, and expectations on top of customer demands and the e-commerce sector as a whole. Whether you’re just getting started in e-commerce or a seasoned industry expert, we have key data points, takeaways, and information to help you better understand the similarities, differences, and strengths of each marketplace. This month, we’ll look at crucial advertising metrics to gain insight into the strategies used by these retail giants.
Our goal is to understand the complexities of their marketing strategies, from examining the stability of Cost Per Click (CPC) rates to understanding the efficiency of Advertising Cost of Sales (ACOS). Throughout our journey, we will monitor the ad spend allocation by Amazon and Walmart, providing valuable insights into their respective strategies. Also, we will look at how these retailers used seasonal events like Valentine’s Day and Presidents’ Day sales to boost sales and engagement. By dissecting these metrics, we hope to provide actionable insights to the sellers, shedding light on Amazon’s effective ad spend utilization and Walmart’s optimization efforts.
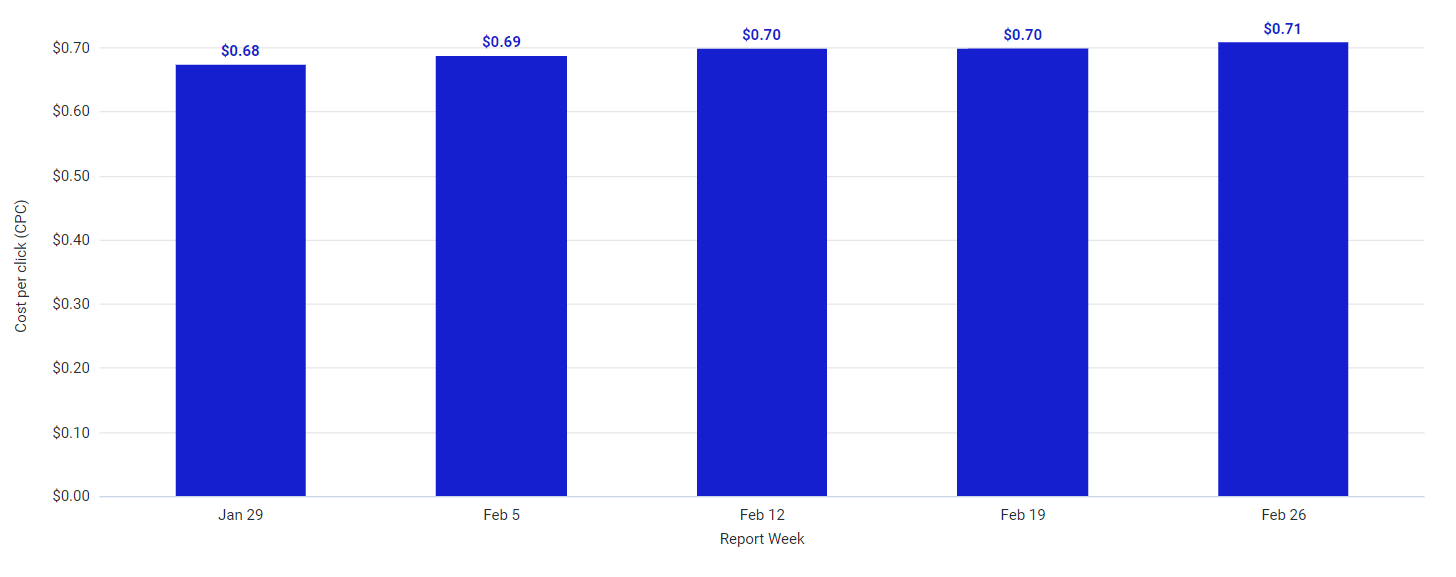
CPC Stability: Unwavering Strategies in the Face of Market Fluctuations
2024
2023
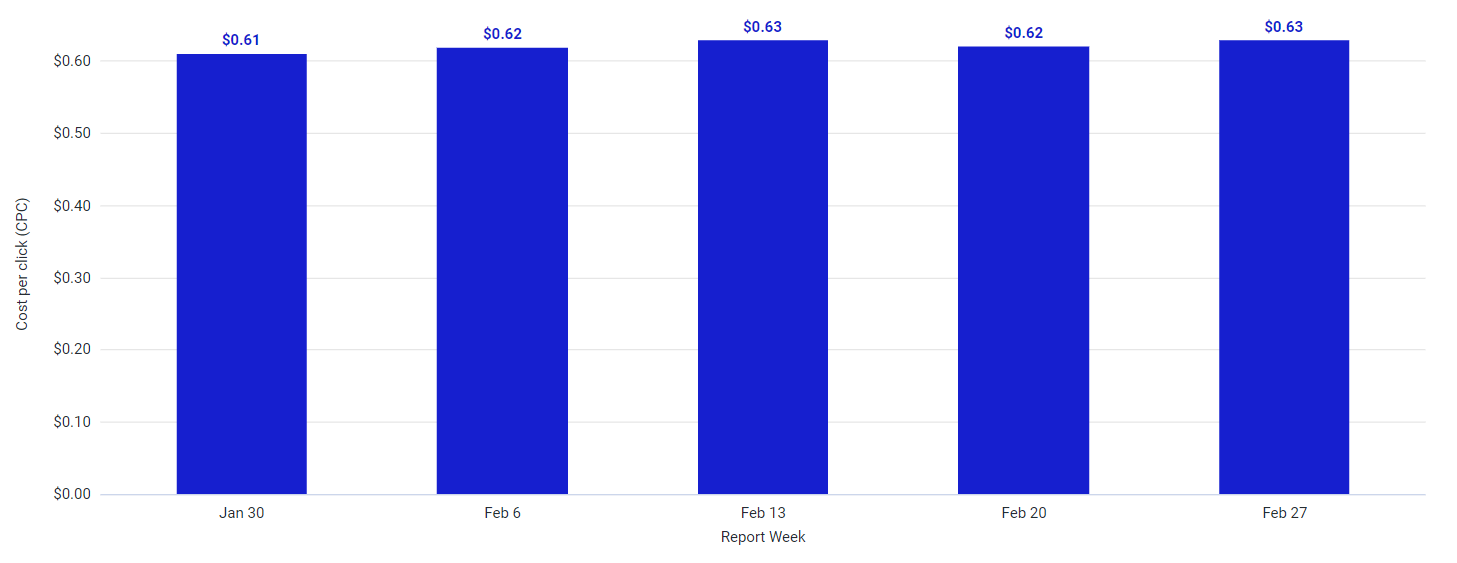
In this analysis, we will look at the advertising landscape for 2023 and 2024, with a focus on February 2024 data. The transition from 2023 to 2024 shows a significant increase in Cost Per Click (CPC), with 2024 having higher rates, indicating a significant increase in advertising costs. This indicates an increase of approximately 16.67% from the highest CPC in 2023 to the highest CPC in 2024, with the lowest CPC increasing by approximately 11.48% between the two years.
Seasonal events, such as Presidents’ Day and Valentine’s Day, most likely contributed to these fluctuations. Advertisers may have ramped up campaigns to capitalize on increased consumer spending during these times, resulting in increased competition and higher CPCs. While both datasets are stable within their respective years, the overall upward trend in 2024 indicates changing market conditions or strategic shifts in advertising approaches. Understanding these factors allows businesses to adapt their strategies effectively, resulting in optimal performance and ROI in a rapidly changing landscape.
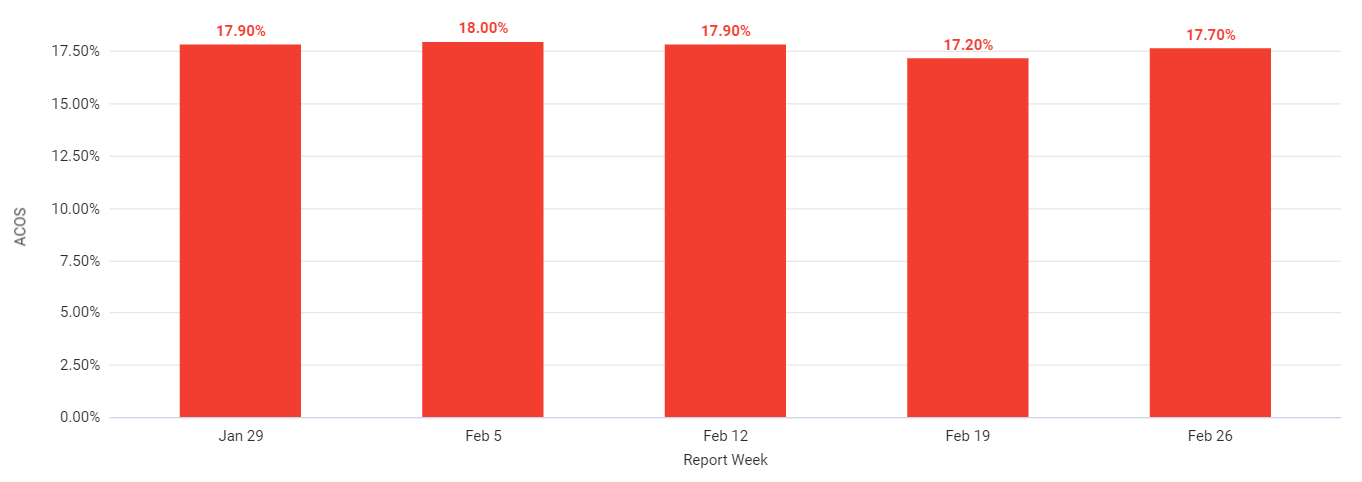
ACOS Efficiency: Contrasting Approaches between Amazon and Walmart
2024
2023
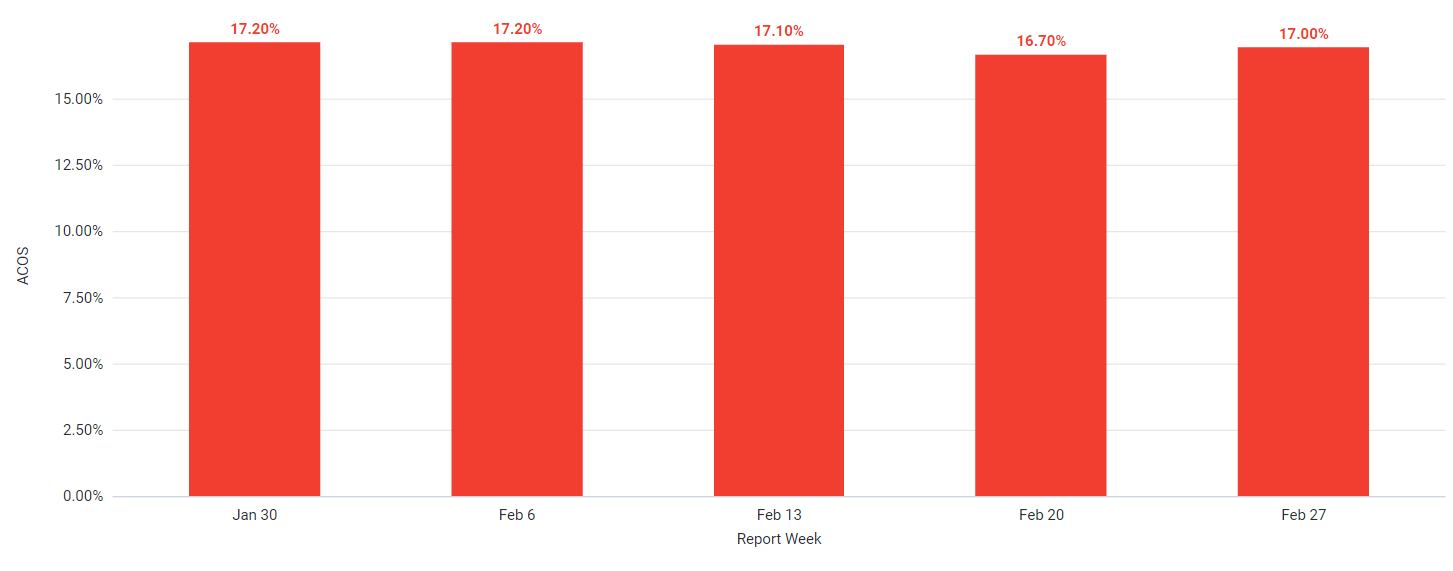
ACOS increases significantly in 2024 when compared to 2023. The highest ACOS in 2023 was 17.20%, while in 2024 it rose to 18.00%, representing a 4.65% increase. Similarly, the lowest ACOS in 2023 was 16.70%, which rose to 17.20% in 2024, representing an increase of approximately 2.99%. These increases reflect potential shifts in advertising efficiency or market conditions that influence the conversion rate of ad clicks to sales.
The ACOS for February 2024 ranged between 17.20% and 18.00%, with weekly fluctuations. Seasonal factors such as Presidents’ Day and Valentine’s Day may have contributed to the higher ACOS during this time period. Advertisers may have ramped up campaigns to capitalize on increased consumer spending, resulting in higher advertising costs and potentially inefficient spending. Also, during these seasonal events, competition among advertisers heats up, increasing ad costs and affecting ACOS. Buyers may respond by being more selective in their purchases or looking for deals and promotions, impacting ad performance and ACOS metrics. Understanding these trends allows businesses to adapt their advertising strategies effectively, ensuring optimal performance and ROI as market dynamics change.
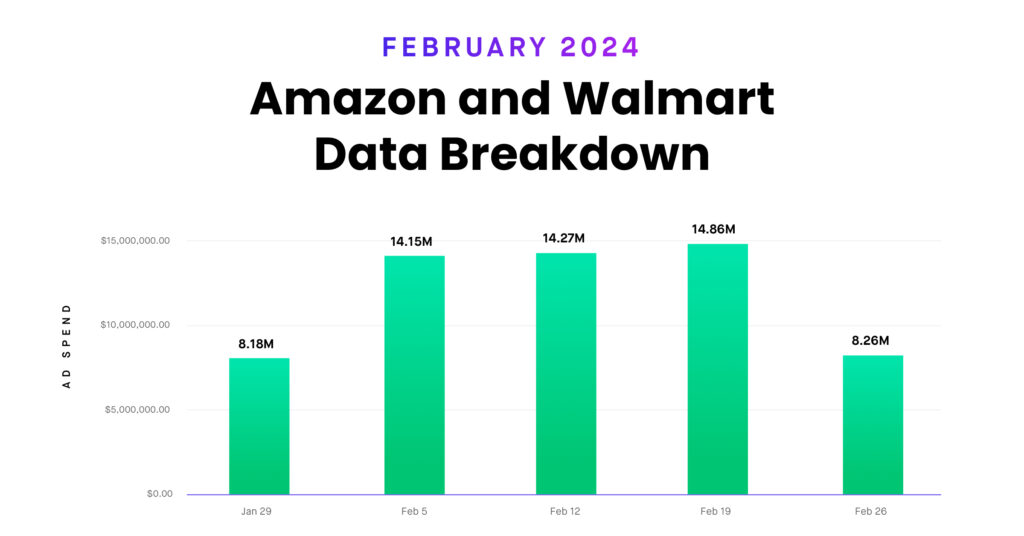
Ad Spend Allocation: Tracking Strategic Maneuvers and Trends
2024
2023
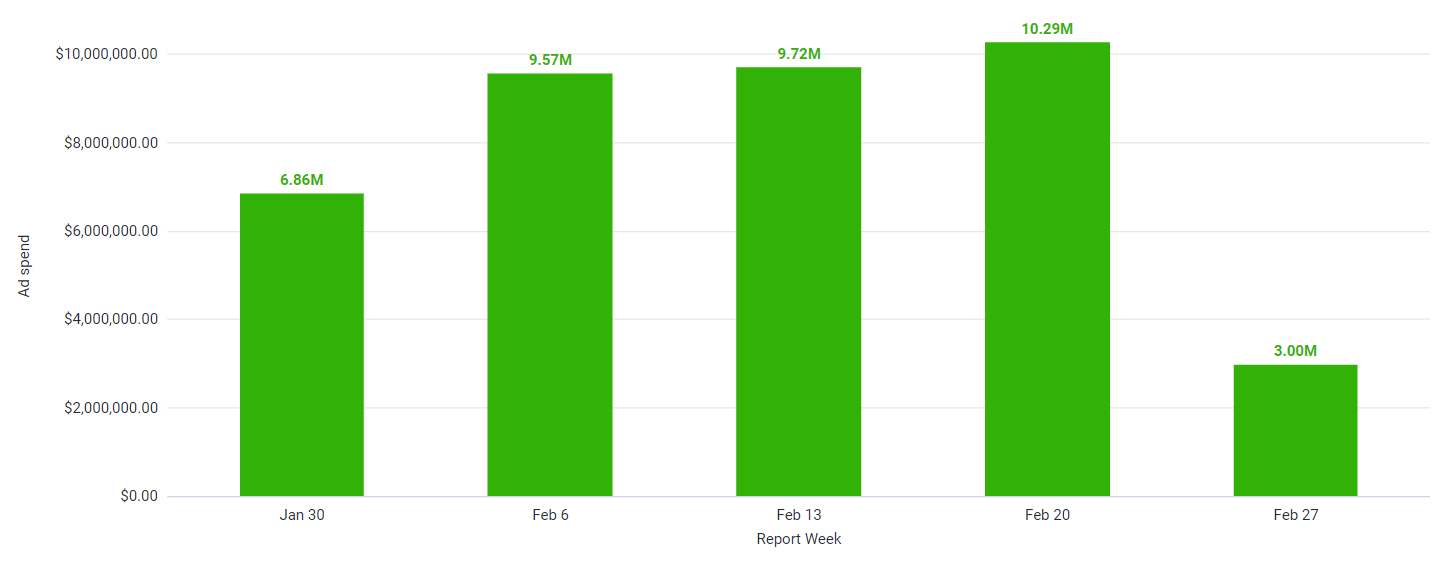
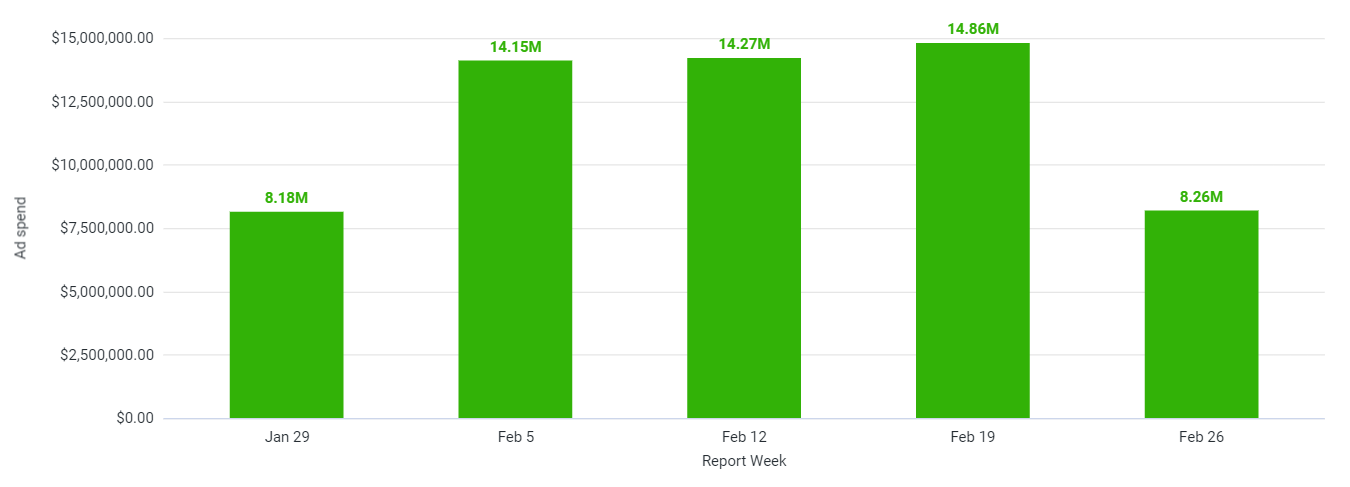
When comparing ad spend in 2023 and 2024 February, there is a significant increase in investment. In 2023, the amount spent on advertising ranged from $2.99M to $10.29M, while in 2024, it increased from $8.18M to $14.86 million. This indicates a significant increase in advertising budgets over the past two years.
Ad spend increased by approximately 175.66%, from $2.99 million (lowest in 2023 Feb) to $8.26 million (lowest in 2024 Feb). Similarly, the highest ad spend in 2023 Feb was $10.29 million, which rose to $14.86 million in 2024 Feb, representing a 44.44% increase.
In February 2024, ad spend showed consistent growth, possibly influenced by seasonal factors such as Presidents’ Day and Valentine’s Day. Advertisers may have increased spending to capitalize on increased consumer engagement during these periods, increasing ad costs. The monthly increase in ad spend suggests strategic changes in marketing strategies or expanded campaign scopes to maximize visibility and drive sales. Understanding these trends allows businesses to allocate budgets more effectively.
Unveiling February’s Advertising Landscape: A Comparative Analysis of Amazon and Walmart
CPC (Cost Per Click):
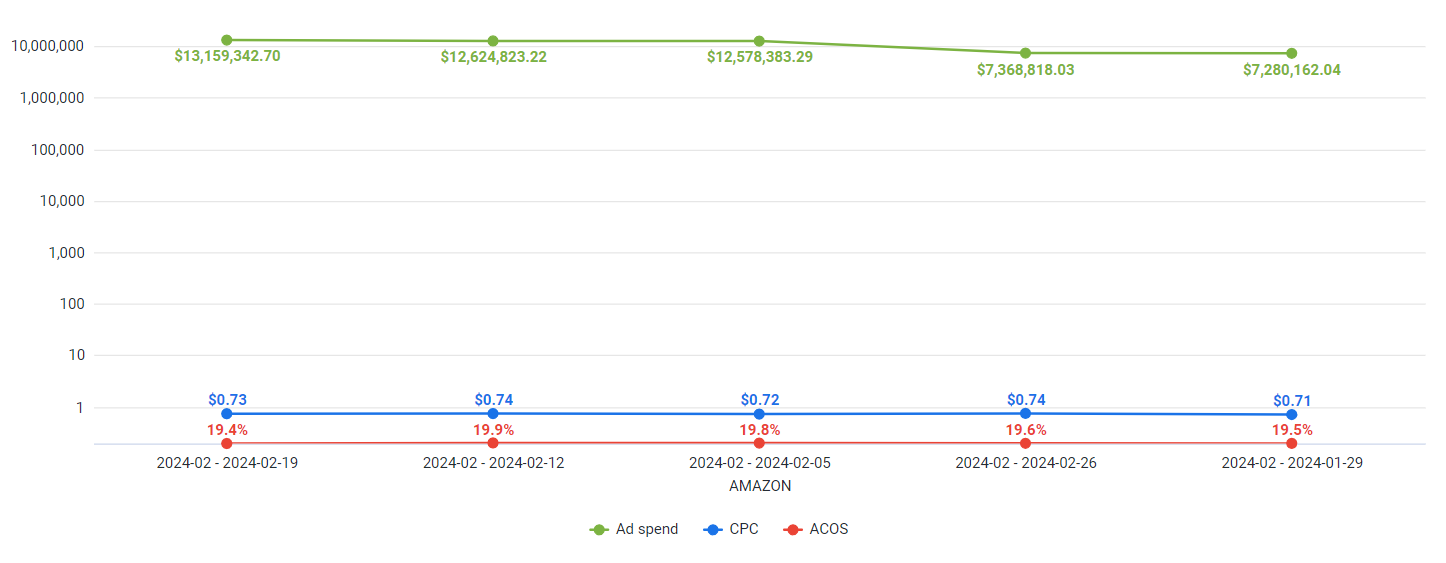
In the ever-changing world of online advertising, Amazon and Walmart demonstrated their prowess with remarkably stable CPC rates. Amazon’s CPC ranged from $0.50 to $0.52, a decrease of about 30.14% from January, while Walmart’s CPC ranged from $0.71 to $0.74, remaining stable from the previous month.
ACOS (Advertising Cost of Sales):
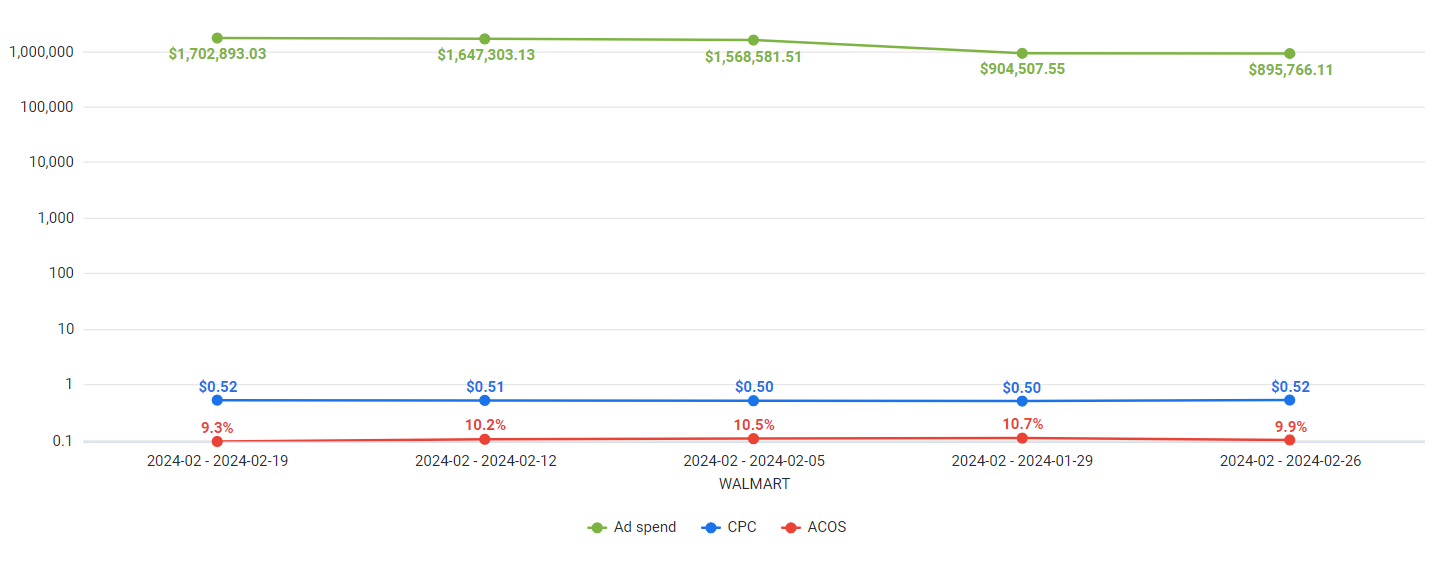
Both Amazon and Walmart provided information about their Advertising Cost of Sales (ACOS). Amazon had a relatively low ACOS, ranging from 9.3% to 10.7%. This represented a decrease of approximately 51.09% from January. Meanwhile, Walmart had a higher ACOS, ranging from 19.4% to 19.9%, with a slight decrease of about 0.20% from January.
Ad Spend:
Follow the money trail, and you’ll uncover the strategic maneuvers of both Amazon and Walmart in ad spend allocation. Amazon’s ad spend climbed steadily from $0.90M to $1.70M, reflecting a significant decrease of approximately 88.76% from January. Meanwhile, Walmart maintained a steady course, with ad spend hovering around similar levels throughout February, showing a reduction of roughly 72.43% from January.
Seasonal Factors:
During February, both Amazon and Walmart took advantage of increased consumer demand and the rush to shop for the holidays. They strategically adjusted their advertising campaigns to maximize impact during peak seasons like Valentine’s Day and Presidents’ Day sales.
Insights for Performance:
Amazon and Walmart have consistent CPC rates, indicating a steadfast approach to advertising in the face of market changes. Amazon’s efficient ad spending, reflected in its low ACOS, contrasts with Walmart’s difficulties in optimizing ad strategies. However, both marketplaces are committed to making informed decisions while navigating the online advertising landscape. Amazon and Walmart are well-positioned for growth, prioritizing stable CPC rates, efficient advertising, strategic spending, and capitalizing on seasonal trends to succeed in online advertising.
February’s Advertising Spotlight: Health & Household and Home & Kitchen Dominate
In February, two categories emerged as frontrunners in the dynamic realm of e-commerce advertising: Health and Household and Home and Kitchen. These categories command a lot of attention and investment because they are relevant and appealing to consumers this month.
Health & Household: February saw increased ad spending in the Health & Household category as consumers prioritize wellness during flu season. Advertisers use this opportunity to promote immune-boosting products and self-care essentials, capitalizing on increased health awareness. Also, with Valentine’s Day approaching, wellness gifts such as skincare sets and relaxation aids become increasingly popular, fueling advertising efforts in this category.
Home & Kitchen: As homeowners start springtime home improvement projects, the Home & Kitchen category sees increased ad spend. Advertisers showcase organization, renovation, and interior design products, capitalizing on consumers’ desire to refresh their living spaces. Also, with Valentine’s Day encouraging culinary creativity and romantic gestures, advertisers focus on kitchen gadgets, cookware sets, and gourmet ingredients to improve at-home dining experiences.
In a nutshell, the increase in ad spend for the Health & Household and Home & Kitchen categories in February is due to seasonal factors, consumer behaviors, and thematic associations with health, wellness, home improvement, and romantic celebrations. Advertisers strategically align their campaigns with these trends to capture consumer attention and drive sales, making these categories the focus of e-commerce advertising efforts this month.
Ready to take this data and make it actionable? Looking for more data to deepen your understanding of the greater e-commerce space and your brand’s position in it? Whatever you need, Teikametrics’ industry-leading AI can help you achieve your goals. From access to near real-time data to optimizing every single listing every single hour, our AI is the game-changing software you need. But don’t take our word for it; experience the difference with a free demo webinar.