This blog post is part 3 of 3 of an ongoing Prime Day 2019 analysis. Check out the Health & Household breakdown from last week, and read the Clothing, Shoes and Jewelry breakdown!
Key Teika-Way
Over the course of Prime Day 2019 within the ‘Home and Kitchen’ category on Amazon, cost-per-clicks (CPCs) rose moderately, while conversion rates remained largely steady. However, products sold in the category saw large average revenue increases, driven chiefly via organic sales.

What You’ll Find in the Report
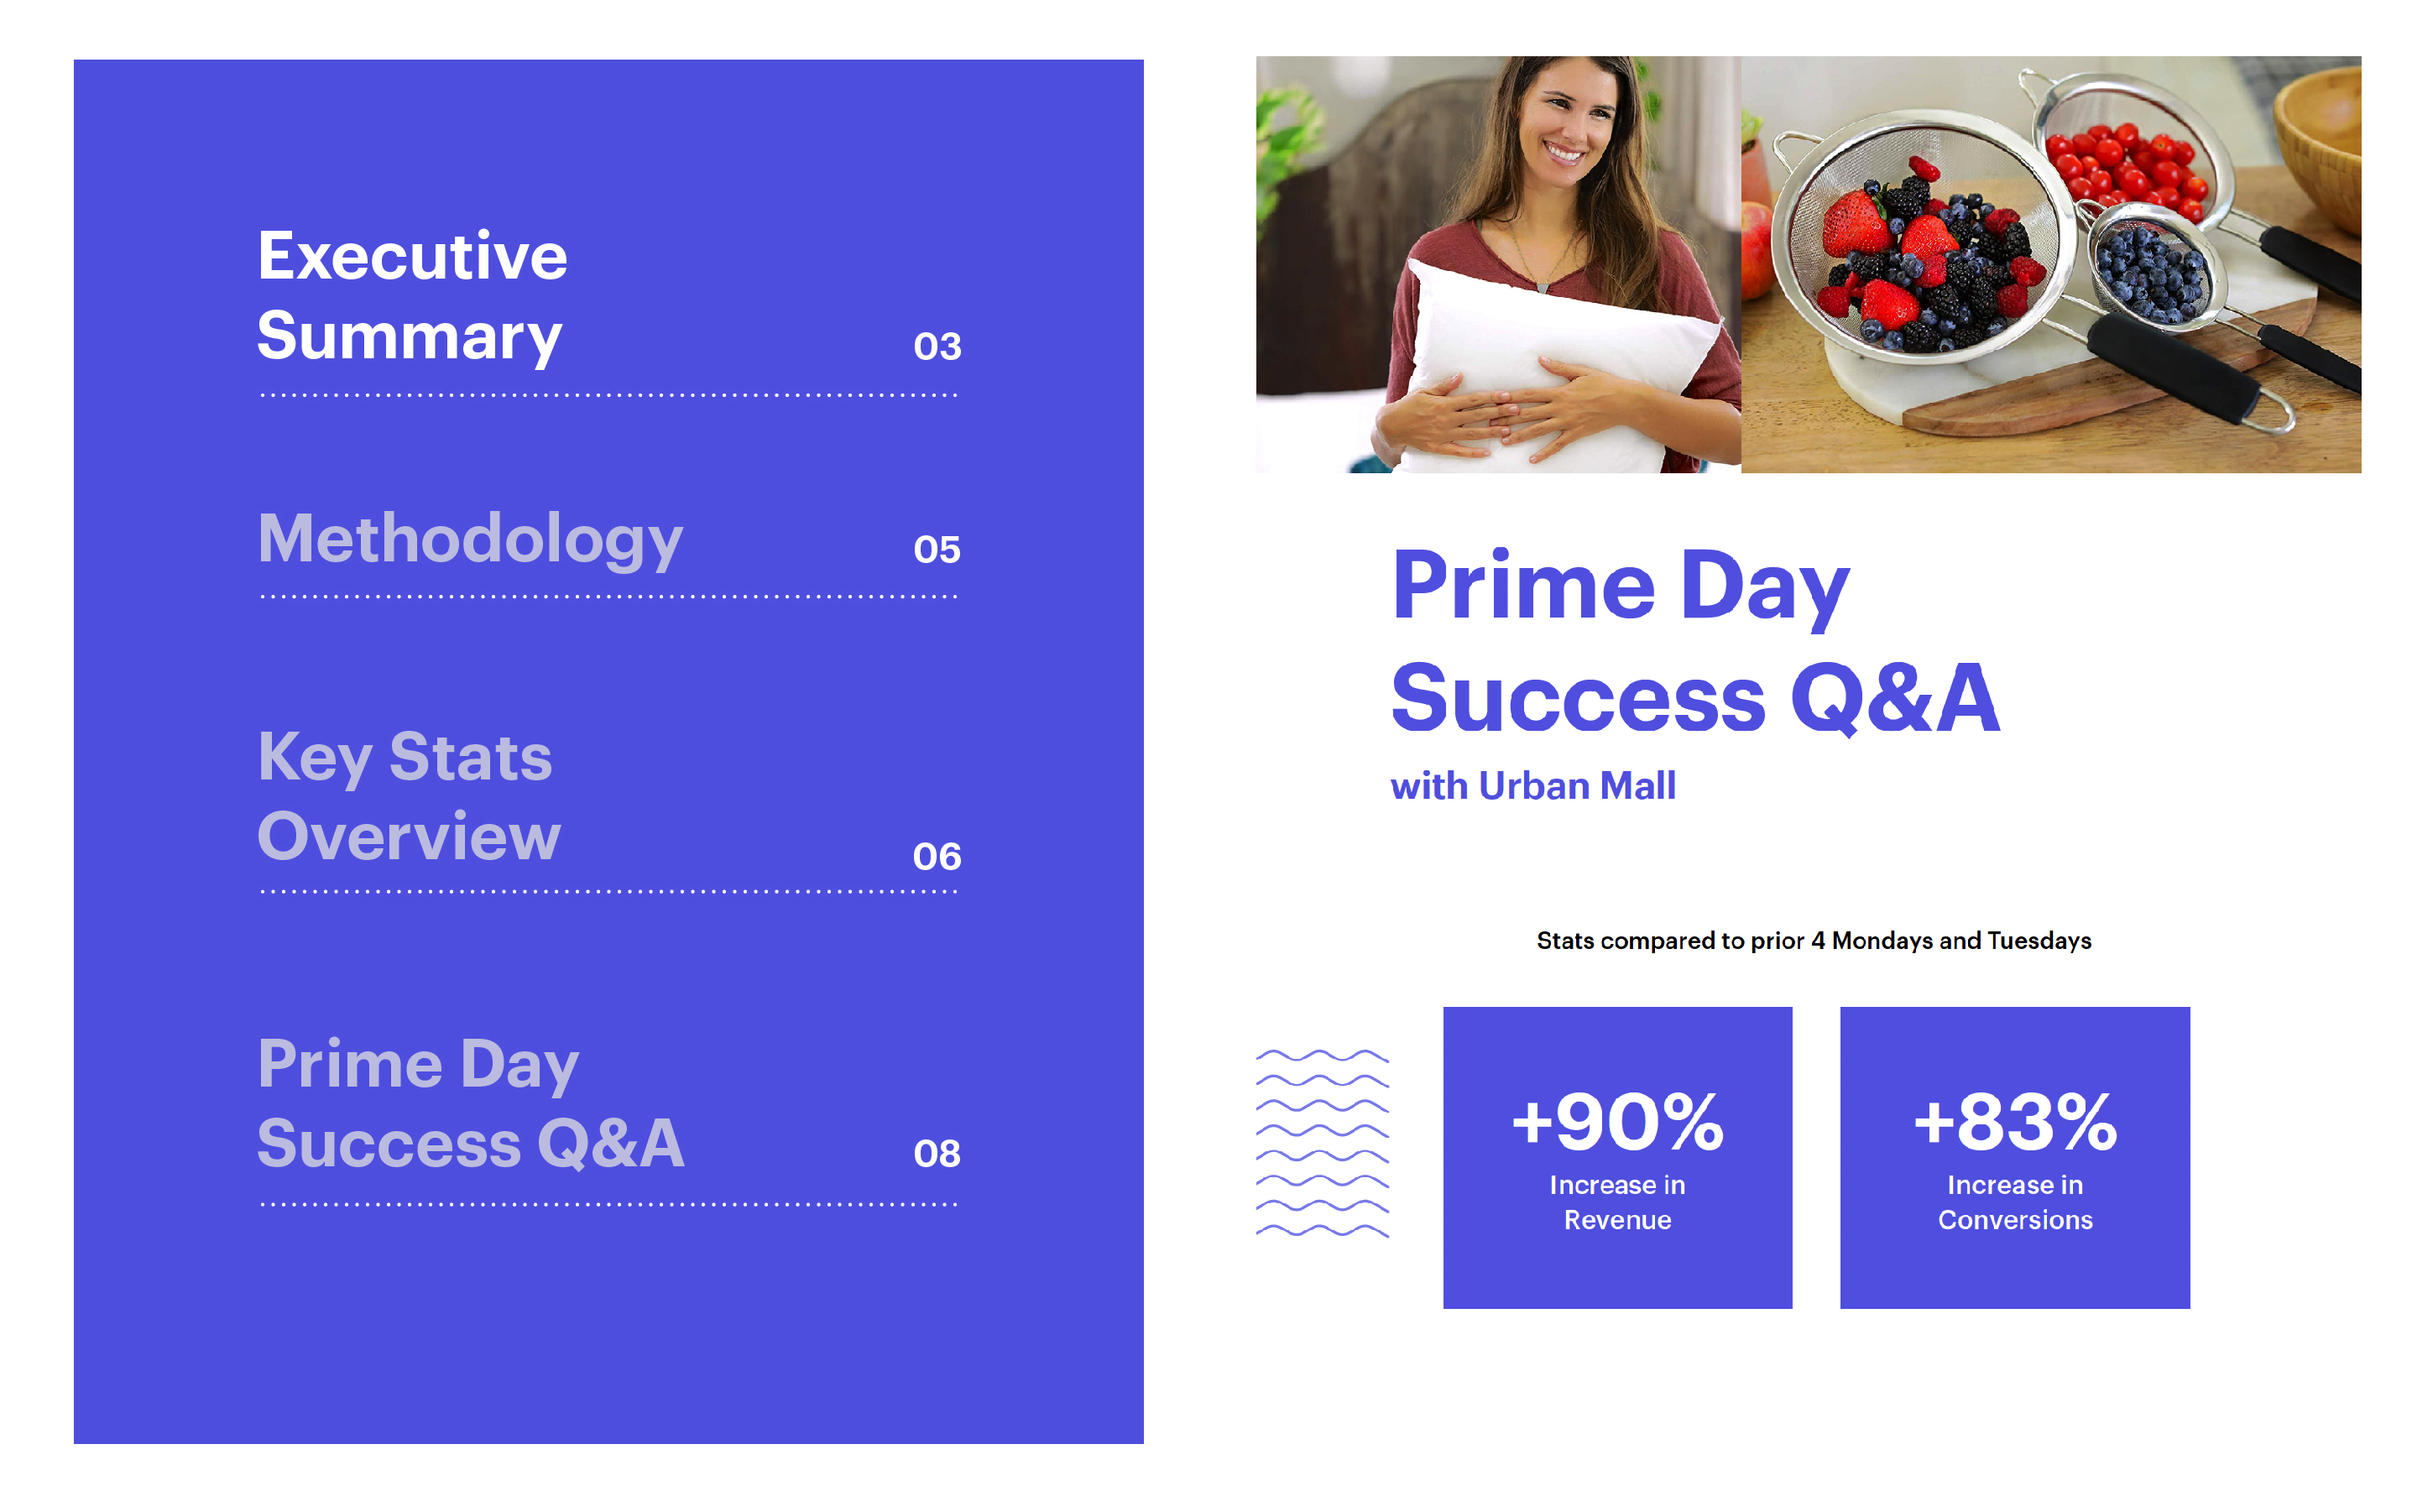
The report details aggregated key performance metrics changes including average CPC, conversion rates, revenue, ad spend, ACoS, and TACoS. Additionally, we interviewed a successful home goods brand, Urban Mall, to understand their unique goals, strategies, expectations, and results for this year’s Prime Day.
Methodology
The data outlined in this study is reflective of sales and advertising activity across more than 2,100 products sold by Teikametrics clients in the ‘Home and Kitchen’ category on Amazon. Metrics utilized within the analysis include organic sales, ad-derived sales, ad spend, and ad clicks. Our data science team designed a comparative analysis of Prime Day (July 15th & 16th 2019) vs. the four Mondays and Tuesdays prior to Prime Day. Specifically, these ‘non-Prime Day’ dates were averages across June 17th, 18th, 24th, and 25th, along with July 1st, 2nd, 8th , and 9th.
Please enjoy our Prime Day 2019 ‘Health and Household’ deep dive. You can sign up to review the report by clicking the button below:


