Effective ecommerce businesses are defined by never resting on their laurels. They are constantly looking for the next big opportunity, for holes in their existing growth plans, and especially for ways to outflank their biggest competitors.
Think about your own business on Amazon. Within your competitive landscape, who are you chasing? What gives them an advantage? Where are they vulnerable?
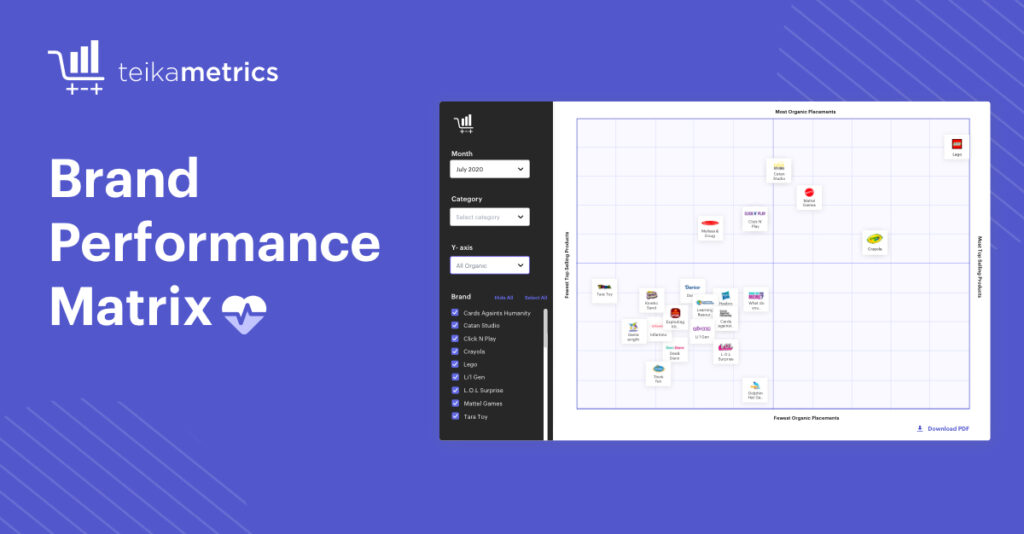
Helping sellers answer these questions is at the heart of our new, free interactive tool – the Brand Performance Matrix (BPM). Based on the first page of results from every one of the top 100,000 search terms on Amazon, you can visualize the top-performing brands across 20 different verticals on Amazon.
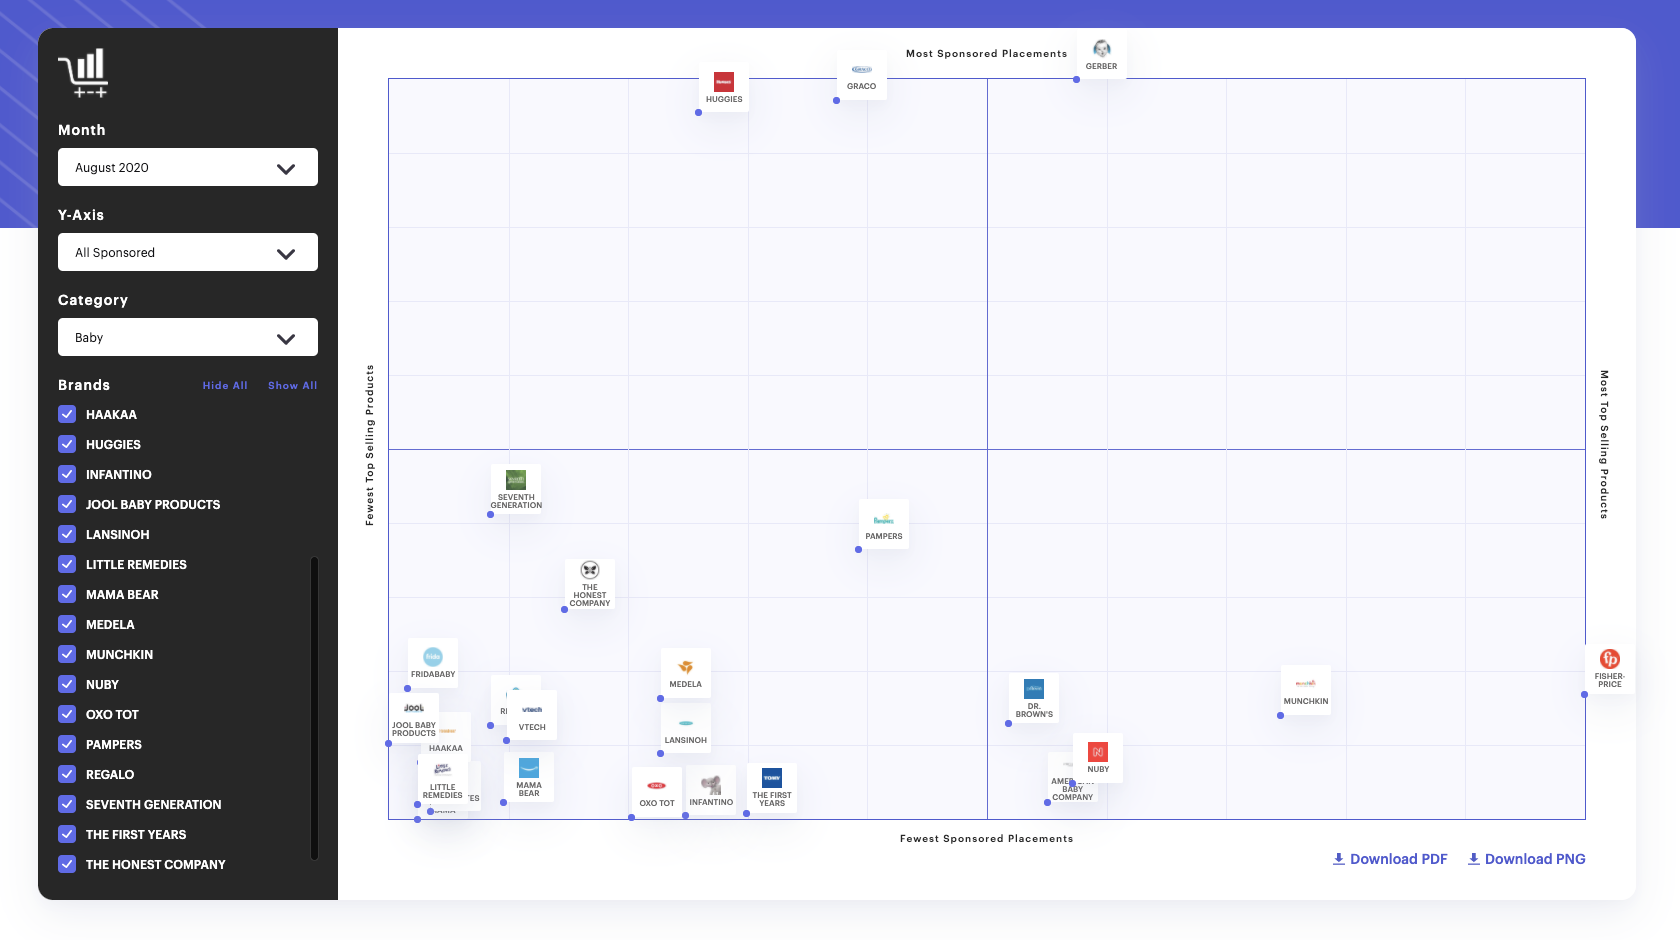
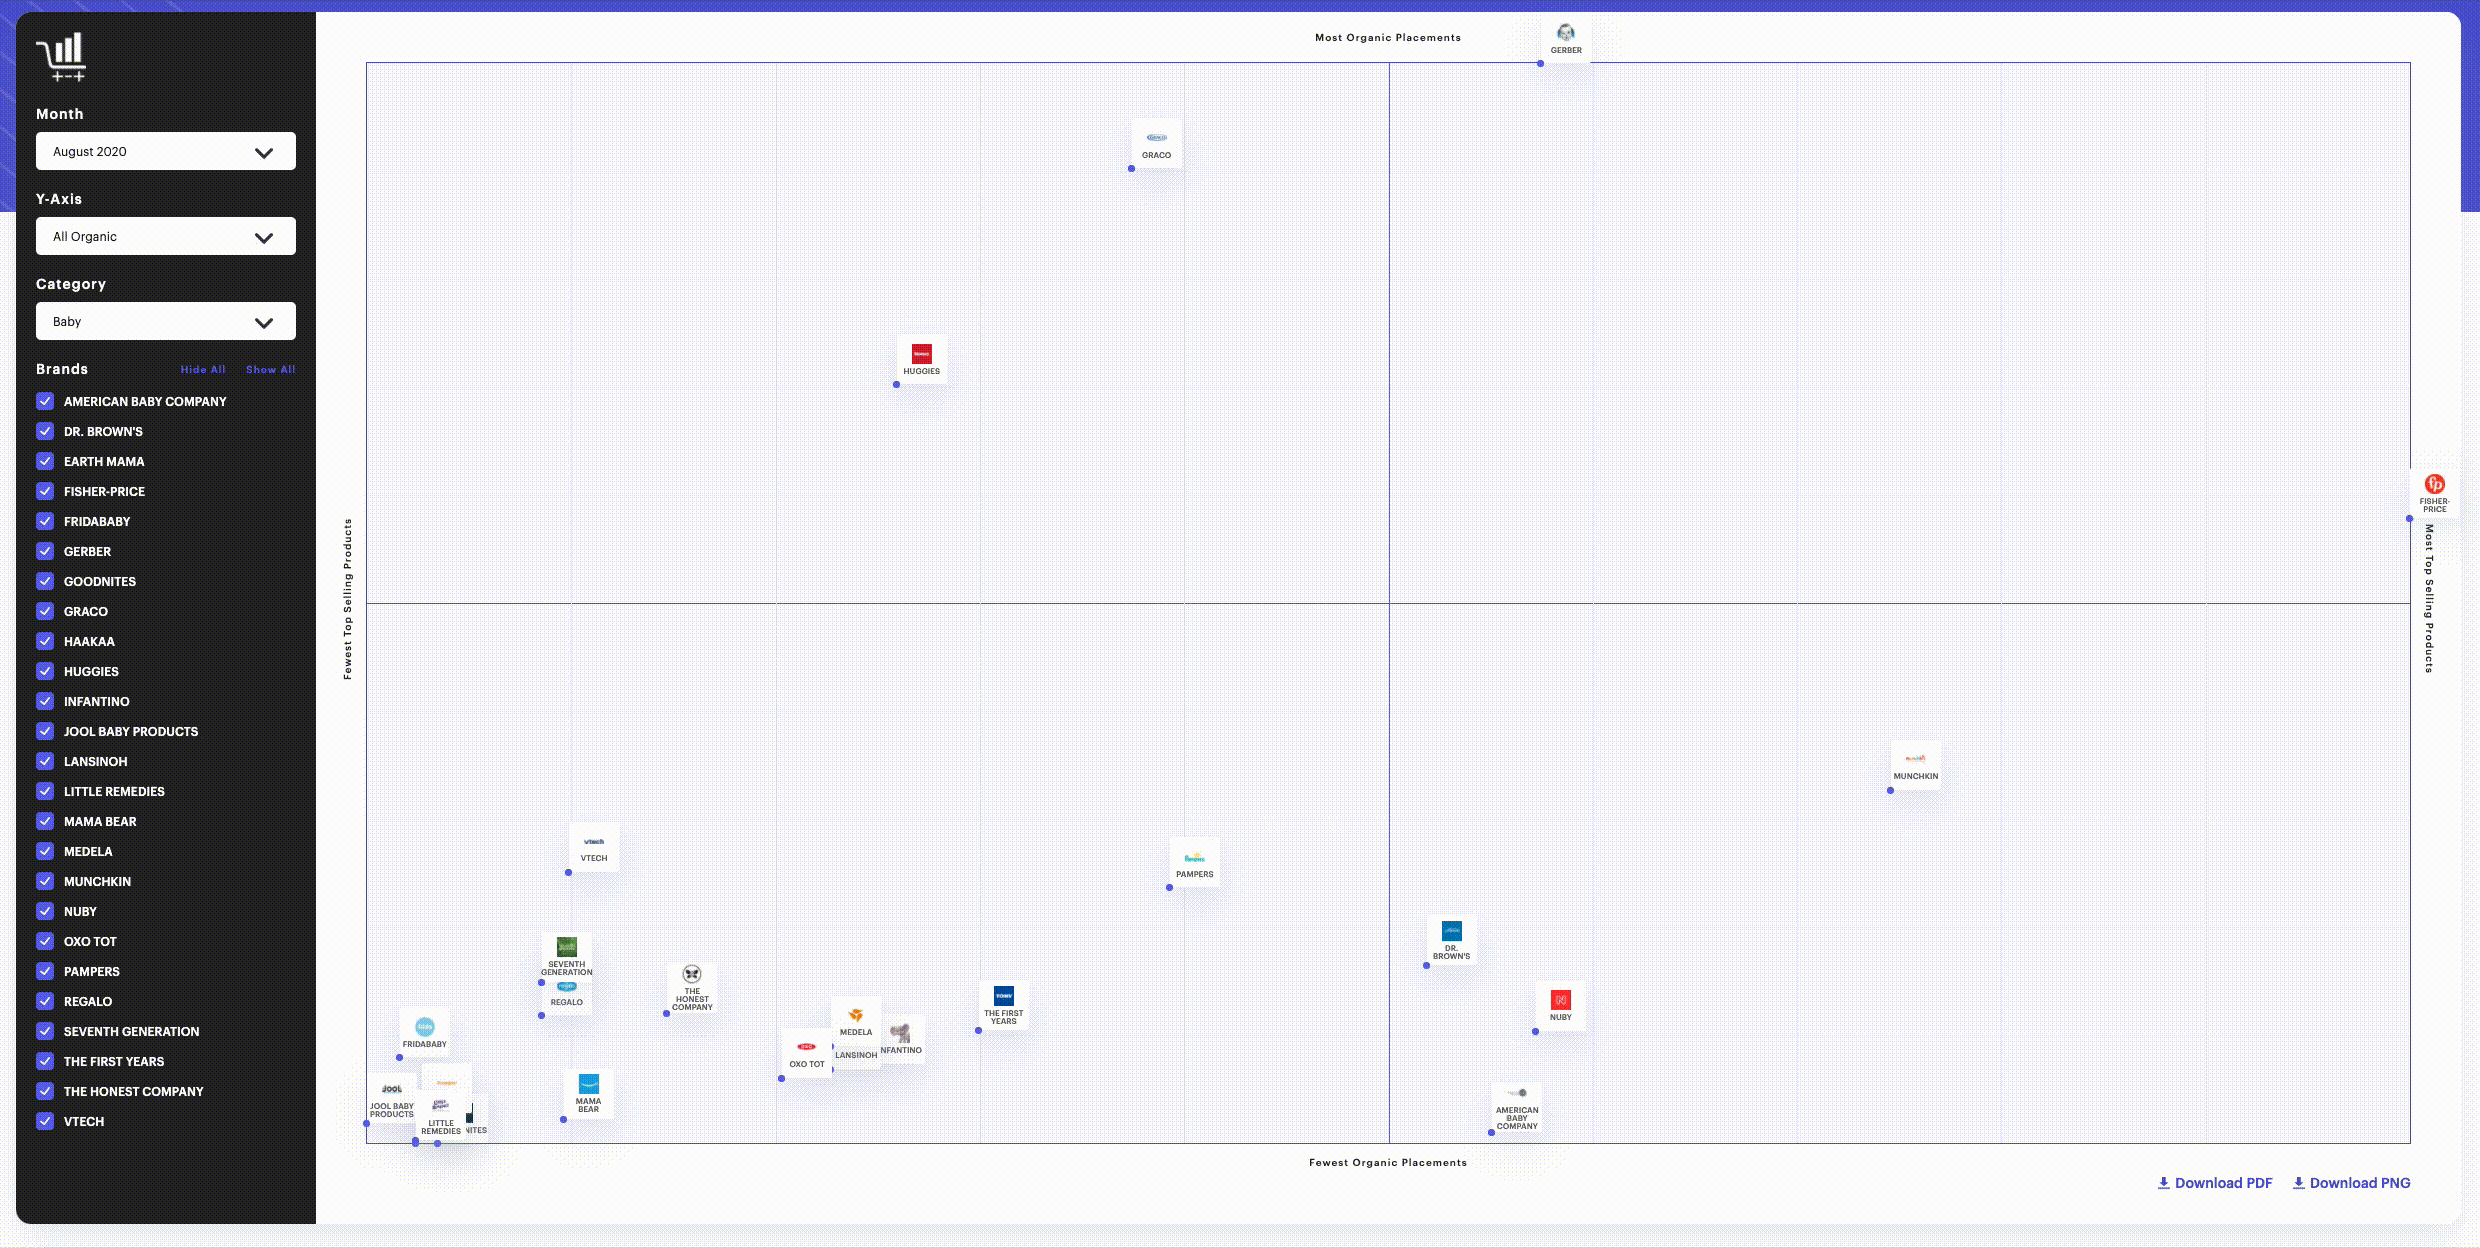
This objective visualization shows you not just which brands boast the most top-selling products, but also how often those products appear across the top 100,000 search terms on Amazon organically, in both Sponsored Products placements and Sponsored Brands placements.
Brand Performance Matrix by Teikametrics
In certain verticals, you’ll see top-performing brands that have a wide variety of top-selling products, but are not ranking organically (or otherwise) on the most frequently searched terms.
Not ranking on those terms is a major potential vulnerability to sales velocity over time, as it’s unlikely that brand’s products are getting in front of customers searching for top, unbranded terms. Competitors stand to take advantage of this deficiency.
Conversely, some brands may only have a few top-selling products but comparatively rank frequently across many popular search terms. This is a great signal that a brand is finding ways to make its products relevant even as consumer search trends for their industry evolve over time.
Looking to just compare a few brands to each other? You can create custom, granular visualizations between specific subsets of brands, simply by selecting and deselecting brand names on the left-hand sidebar, with the graph rescaling as you go, as seen in the animated gif below.
How the Brand Performance Matrix works
We’ll be updating this tool with new data each and every month so you can track progress of top performers over time.
In the meantime, we encourage you to use this tool to gut check your own performance vis a vis your competitors and use the tool’s export functionality to share the visualizations with colleagues and friends.
We hope you enjoy this first of many free data tools from Teikametrics.