If you want to tackle advertising on two e-commerce giants, Amazon and Walmart, you will need data. It can take a lot of work to keep up with their regular updates, changes, and expectations on top of customer demands and the e-commerce sector as a whole. Whether you’re just getting started in e-commerce or a seasoned industry expert, we have key data points, takeaways, and information to help you better understand the similarities, differences, and strengths of each marketplace. This month, we’ll look at crucial advertising metrics to gain insight into the strategies used by these retail giants.
Our goal is to understand the complexities of their marketing strategies, from examining the stability of Cost Per Click (CPC) rates to understanding the efficiency of Advertising Cost of Sales (ACOS). Throughout our journey, we will monitor the ad spend allocation by Amazon and Walmart, providing valuable insights into their respective strategies. Also, we will look at how these retailers used March Madness sales, offering special promotions and advertising campaigns to capitalize on the tournament’s devoted fan base, as well as initiatives for St. Patrick’s Day, with the goal of increasing sales and engagement during these cultural celebrations. By dissecting these metrics, we hope to provide actionable insights to the sellers, shedding light on Amazon’s effective ad spend utilization and Walmart’s optimization efforts.
CPC Stability: Unwavering Strategies for Market Fluctuations


In this analysis, we’ll delve into the advertising landscape for 2023 and 2024, focusing on March data. The transition from March 2023 to March 2024 reveals a notable increase in Cost Per Click (CPC), with 2024 exhibiting higher rates, indicating a significant rise in advertising costs. Specifically, comparing the highest CPC in March 2023 to March 2024, there’s an increase of approximately 19.40%, while the lowest CPC shows an increase of roughly 21.43% between the two years.
Seasonal events like Easter or Spring sales likely contributed to these fluctuations. Advertisers may have intensified campaigns to capitalize on heightened consumer spending during these periods, leading to increased competition and higher CPCs. While both datasets remain stable within their respective years, the overall upward trend in 2024 suggests shifting market conditions or strategic adjustments in advertising approaches. Understanding these factors is pivotal for businesses to adapt their strategies effectively, ensuring optimal performance and ROI in a rapidly evolving landscape.
Additionally, Amazon’s CPC increased by 20% from 2023 to 2024, while Walmart’s increased by 23.40% during the same period. These increases reflect a general trend of rising advertising costs across various sales channels.
ACOS Efficiency: Contrasting Approaches between Amazon and Walmart


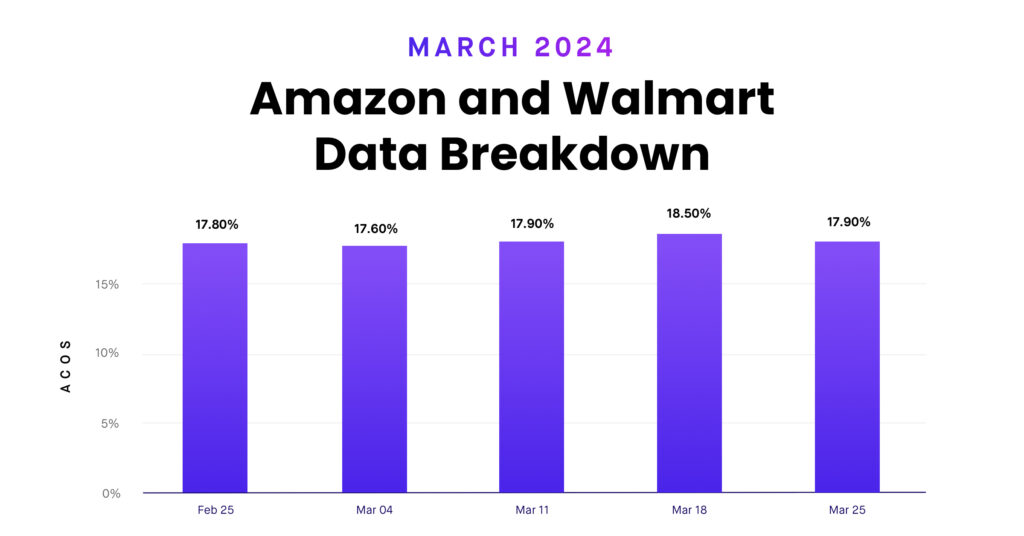
ACOS increased significantly in March 2024 when compared to March 2023. The highest ACOS in March 2023 was 17.20%, while in March 2024 it rose to 18.50%, representing a 7.56% increase. Similarly, the lowest ACOS in March 2023 was 16.70%, which rose to 17.60% in March 2024, representing an increase of approximately 5.39%. These increases reflect potential shifts in advertising efficiency or market conditions that influence the conversion rate of ad clicks to sales.
The ACOS for March 2024 ranged between 17.60% and 18.50%, with weekly fluctuations. Seasonal factors such as St. Patrick’s Day and the onset of spring may have contributed to the higher ACOS during this time period. Advertisers may have ramped up campaigns to capitalize on increased consumer spending, resulting in higher advertising costs and potentially inefficient spending. Also, during these seasonal events, competition among advertisers heats up, increasing ad costs and affecting ACOS. Buyers may respond by being more selective in their purchases or looking for deals and promotions, impacting ad performance and ACOS metrics. Understanding these trends allows businesses to adapt their advertising strategies effectively, ensuring optimal performance and ROI as market dynamics change.
The ACOS on Amazon increased by approximately 2.03% from 2023 to 2024, and the ACOS on Walmart increased by approximately 1.03% from 2023 to 2024.
Ad Spend Allocation: Tracking Strategic Maneuvers and Trends


When comparing ad spend in March 2023 and March 2024, there is a substantial increase in investment. In March 2023, the amount spent on advertising ranged from $9.41M to $13.41M, while in March 2024, it increased from $15.25M to $17.02 million. This indicates a significant surge in advertising budgets over the span of a year.
Ad spend increased by approximately 61.87%, from $9.41 million (lowest in March 2023) to $15.25 million (lowest in March 2024). Similarly, the highest ad spend in March 2023 was $13.41 million, which rose to $17.02 million in March 2024, representing a 26.89% increase.
In March 2024, ad spend demonstrated consistent growth, possibly influenced by seasonal factors such as St. Patrick’s Day and the Spring sales event. Advertisers may have heightened spending to capitalize on events or holidays during this period, leading to increased consumer engagement and higher ad costs. The monthly increase in ad spend suggests strategic adjustments in marketing tactics or expanded campaign scopes to maximize visibility and drive sales. Recognizing these trends empowers businesses to allocate budgets more effectively.
Amazon’s ad spend increased by approximately 22.3% from 2023 to 2024, while Walmart’s increased by approximately 14.2% over the same period.
Unveiling March’s Advertising Landscape: A Comparative Analysis of Amazon and Walmart

CPC (Cost Per Click):
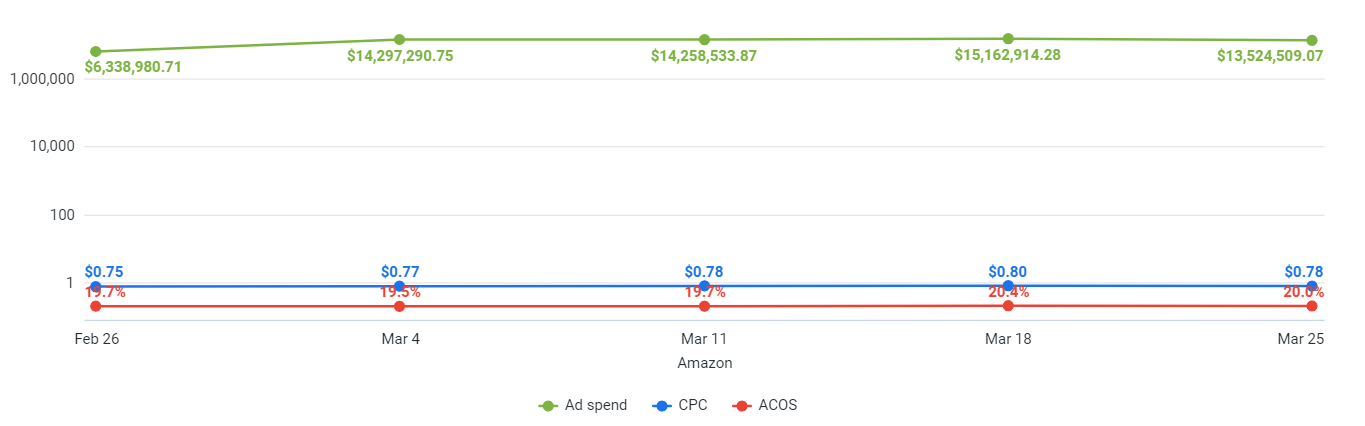
In the ever-changing world of online advertising, Amazon and Walmart demonstrated their prowess with remarkably stable CPC rates. Amazon’s CPC ranged from $0.77 to $0.78, an increase of about 2.6% from February, while Walmart’s CPC increased about 5.8% from February.
ACOS (Advertising Cost of Sales):
Both Amazon and Walmart provided information about their Advertising Cost of Sales (ACOS). Amazon had a relatively low ACOS, ranging from 19.5% to 20.4%. This represented a slight increase of approximately 0.5% from February. Meanwhile, Walmart had a higher ACOS, consistently at 10.4%, with no change from the previous month.
Ad Spend:
Follow the money trail, and you’ll uncover the strategic maneuvers of both Amazon and Walmart in ad spend allocation. Amazon’s ad spend fluctuated throughout March, ranging from $6.33M to $15.16M, reflecting an increase of approximately 7.87% from February. Meanwhile, Walmart maintained a steady course, with ad spend hovering around similar levels throughout March, showing a rise of 16.6% from February.
Seasonal Factors:
During March, both Amazon and Walmart may have capitalized on seasonal factors such as the anticipation of spring and ongoing consumer demand. They strategically adjusted their advertising campaigns to maintain visibility and engagement during this period.
Insights for Performance:
Amazon and Walmart have consistent CPC rates, indicating a steadfast approach to advertising despite market changes. Amazon’s efficient ad spending, reflected in its relatively low ACOS, contrasts with Walmart’s consistent CPC rates and slightly higher ACOS. However, both marketplaces demonstrate their commitment to making informed decisions while navigating the online advertising landscape, positioning themselves for growth and success.
Advertising Spotlight: March’s Winners Emerge in Health & Home Sectors
During March, two categories from Amazon and one category from Walmart emerged as frontrunners in the dynamic realm of e-commerce advertising:
Amazon- Health and Household and Home and Kitchen. These categories command a lot of attention and investment because they are relevant and appealing to consumers this month.
Health & Household: March witnessed a surge in ad spending within the Health & Household category as consumers prioritize their well-being amidst the transition from winter to spring. With the arrival of allergy season and the lingering concerns about flu and colds, advertisers seized the opportunity to promote immune-boosting supplements, allergy relief products, and seasonal wellness essentials. Furthermore, as individuals sought to revitalize after the winter months, there’s an increased emphasis on self-care rituals and fitness regimens, driving advertising efforts in this category.
Home & Kitchen: With the arrival of spring, the Home & Kitchen category experienced a notable uptick in ad spend as homeowners embarked on seasonal cleaning and renovation projects. Advertisers showcased products geared towards organization, outdoor living, and gardening, catering to consumers’ aspirations of rejuvenating their living spaces for the brighter season. Additionally, as the weather warmed up and outdoor entertaining became more prevalent, advertisers focused on promoting grilling essentials, patio furniture, and outdoor décor, tapping into the desire for al fresco dining and gatherings.
Walmart- Home: In March, Walmart’s Home category saw increased ad spending as spring inspired household updates. Advertisers spotlighted furniture, décor, and storage solutions for seasonal refreshments. With spring cleaning in focus, organizational tools and eco-friendly cleaners gained prominence. During Easter, ads highlighted festive décor and entertaining essentials. Walmart catered to diverse needs with affordability and variety, ensuring customers find everything for memorable celebrations and home enhancements.
In a nutshell, the increase in ad spend for the Health & Household and Home & Kitchen categories in March was due to seasonal factors, consumer behaviors, and thematic associations with health, wellness, home improvement, and sales events. Advertisers strategically aligned their campaigns with these trends to capture consumer attention and drive sales, making these categories the focus of e-commerce advertising efforts this month.
Ready to take this data and make it actionable? Looking for more data to deepen your understanding of the greater e-commerce space and your brand’s position in it? Whatever you need, Teikametrics’ industry-leading AI can help you achieve your goals. From access to near real-time data to optimizing every listing every hour, our AI is the game-changing software you need. But don’t take our word for it; experience the difference with a free demo webinar.