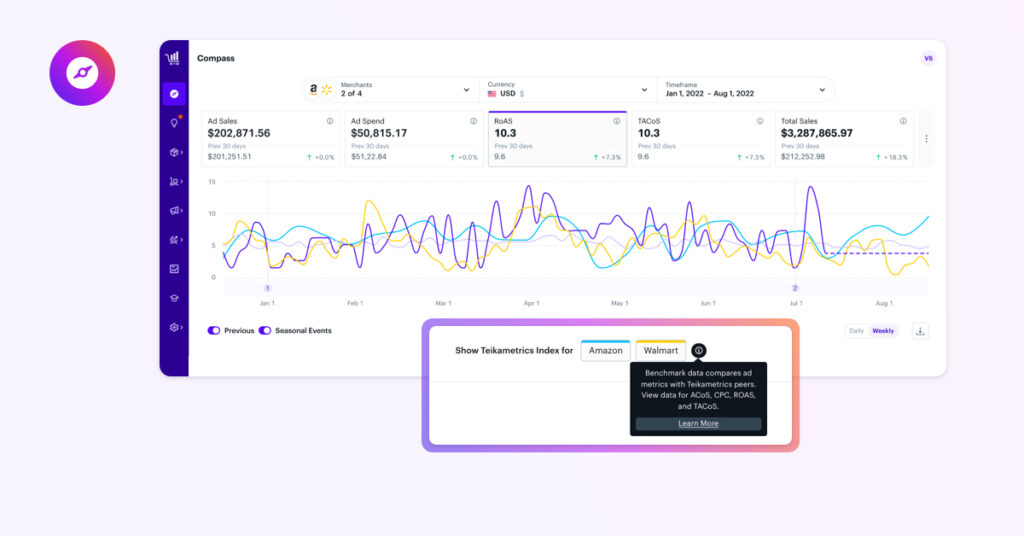
The Teikametrics Index data is your secret weapon to supercharge your advertising strategies. By enabling you to compare your ad metrics with those of Teikametrics peers, this feature empowers you to make data-driven decisions and stay ahead of the competition. Better yet, key data is more accessible than ever, showcased right on the homepage of Flywheel 2.0: Compass. To kick off this powerful new feature, let’s review why benchmark data is vital to your business and how Flywheel 2.0 takes advantage of this resource.
How Benchmark Data Works:
Benchmark data is your compass to navigate the Amazon and Walmart marketplaces. It covers vital metrics such as CPC, ROAS, TACoS, and ACoS. When you select one of these metrics in Flywheel 2.0’s Compass, the Teikametrics Index presents your performance data as a line on the graph, side by side with benchmark data. This benchmark data represents the combined performance of Teikametrics users. You have the flexibility to choose between the Teikametrics Index for Amazon, Walmart, or both, giving you an accurate view of whatever you need to know at any given time.
In the current iteration of the Teikametrics Index, benchmark data is an aggregate value based on the first advertised date across all products and categories. Amazon data is available for 21 countries. Currently, Walmart benchmark data is exclusively available for the U.S.
How the Teikametrics Index Harnesses the Power of Benchmark Data:
Benchmark data serves as your baseline for evaluating advertising performance. It provides valuable insights into how your metrics compare to those of other Teikametrics users, including CPC, ROAS, TACoS, and ACoS.
Category Variability: Keep in mind that category competitiveness can influence metrics. More competitive categories may exhibit different metrics than less competitive ones. So, your category’s competitiveness is a crucial factor to consider.
Marketplace Dynamics: Different marketplaces can have distinct advertising dynamics. Consequently, benchmark data may vary between marketplaces, reflecting the unique advertising landscapes of each platform.
Strategy Adjustments: If you observe notable differences between your metrics and the benchmark, it’s an opportunity to fine-tune your advertising strategies for better results.
Experience the Difference
The Teikametrics Index data provides a valuable perspective on your advertising metrics by comparing them to aggregated data from Teikametrics users across various categories. While benchmark data is an excellent tool for performance assessment, it’s crucial to consider category competitiveness, seasonality, events, and marketplace differences when interpreting the data. Make it a part of your comprehensive insights toolkit to make informed decisions about your advertising strategy. With Benchmark Data in Compass, you’re equipped to take your ad campaigns to new heights. See how the Teikametrics Index, Flywheel 2.0’s industry-leading AI technology, and our managed-services experts can set you ahead with a no-risk, 30-day trial.


